Fig. 1
Download original image
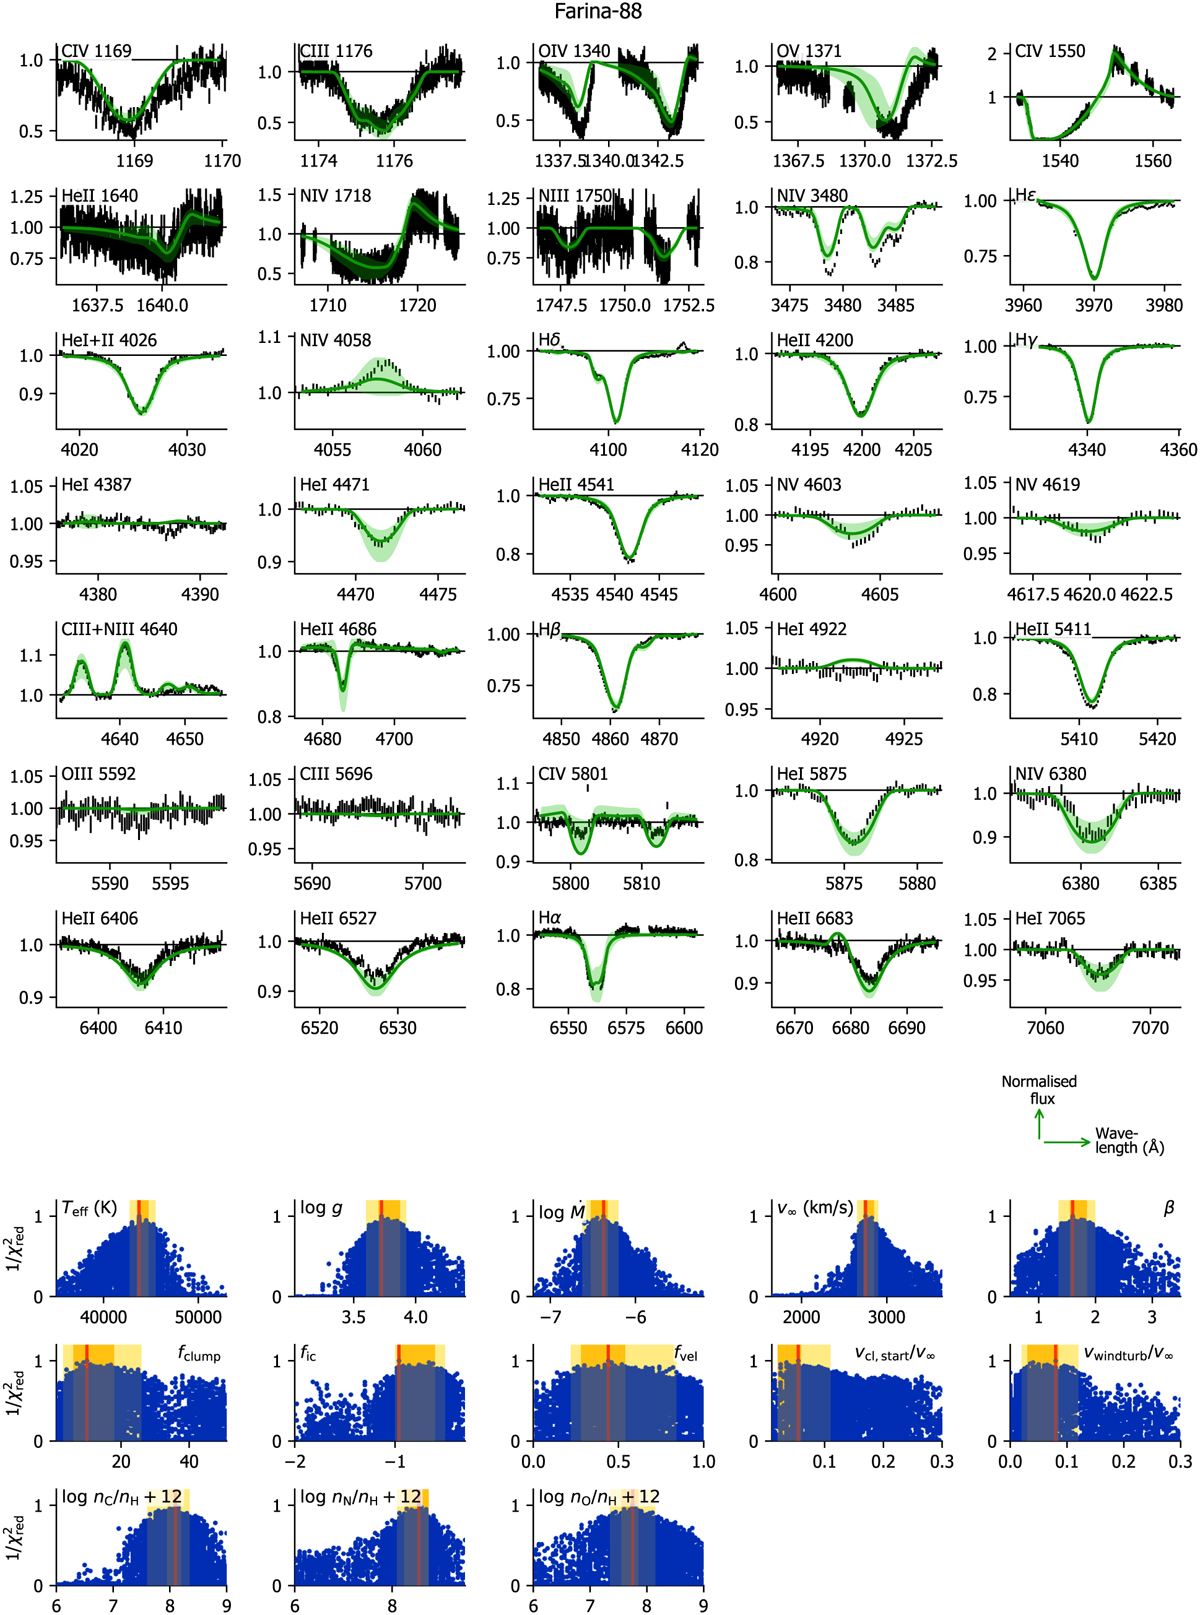
Output summary of the optical and UV Kiwi-GA run of Farina-88 (O4 III(f)). The top part of the figure shows all used diagnostics: the observed spectra (black; vertical bars show uncertainty on each observed flux), the best fit model (dark green solid line), and the uncertainty region (light green shaded area; this area covers all model spectra of which the parameters lie within the 2σ uncertainties). The bottom part of the figure shows the fitness distribution (blue dots) of all parameters that were fitted in the optical and UV run; red vertical lines indicate the best fit value, the shaded regions indicate 1σ (orange) and 2σ (yellow) uncertainty margins. Output summaries of the other stars can be found on Zenodo.
Current usage metrics show cumulative count of Article Views (full-text article views including HTML views, PDF and ePub downloads, according to the available data) and Abstracts Views on Vision4Press platform.
Data correspond to usage on the plateform after 2015. The current usage metrics is available 48-96 hours after online publication and is updated daily on week days.
Initial download of the metrics may take a while.