Fig. 7.
Download original image
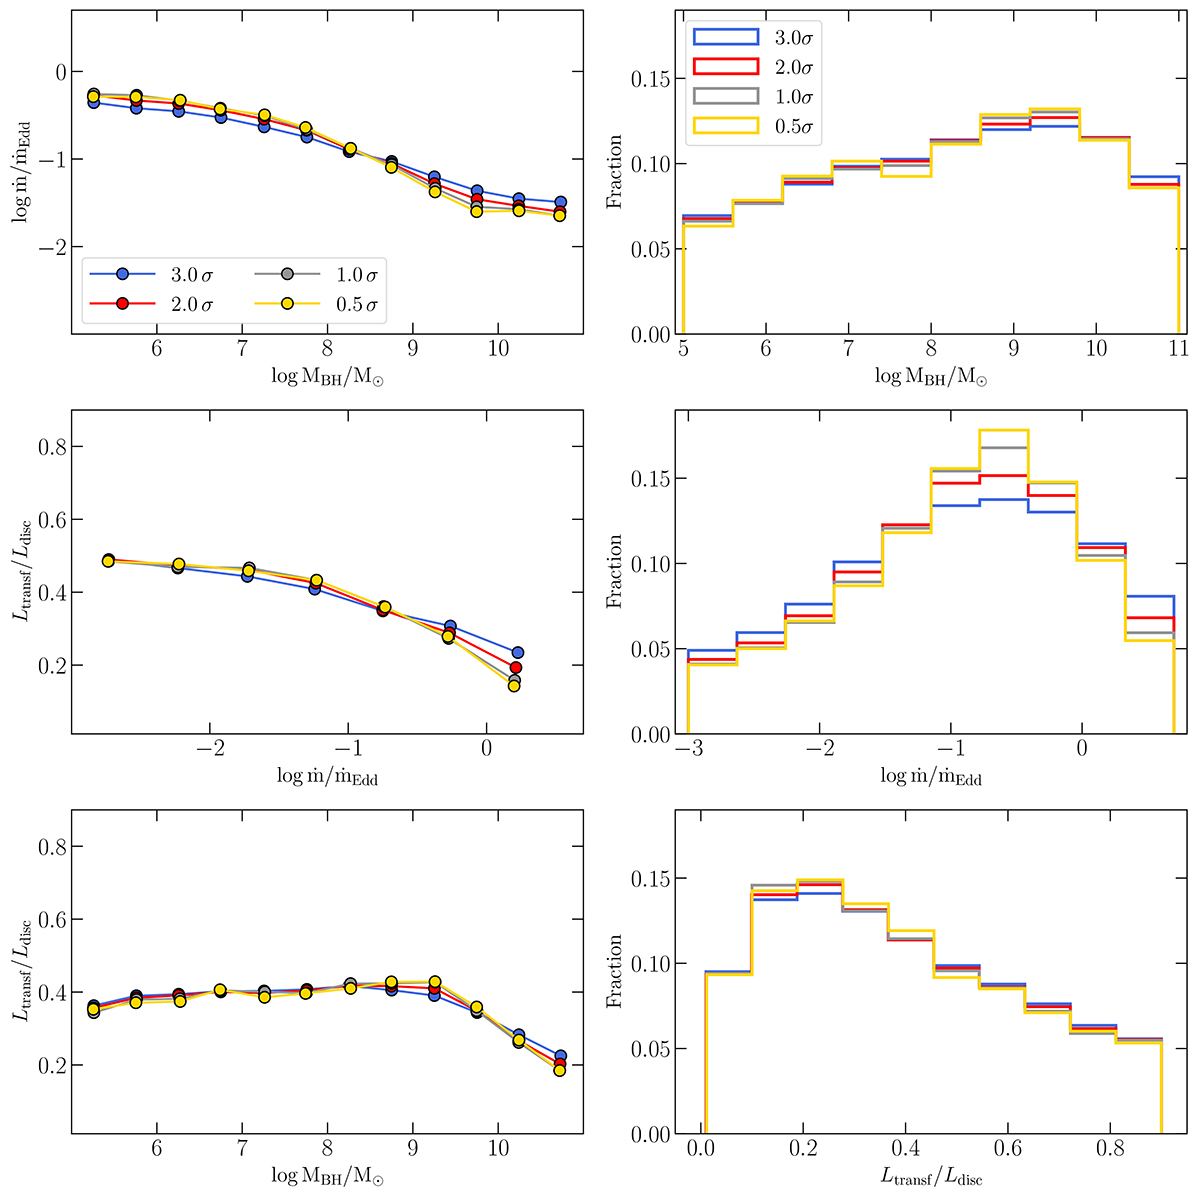
Left: Average correlations between log ṁ/ṁEdd, log MBH, and Ltransf/Ldisc, similar to Fig. 3 considering different values of the scatter around the best-fit L2 keV–L2500 Å correlation ranging between 0.5σ and 3σ. Right: Distribution of log MBH, log ṁ/ṁEdd, and Ltransf/Ldisc (top to bottom) for the selected subset of SEDs that agree with the observed L2 keV − L2500 Å correlation assuming a scatter around the best fit between 0.5σ and 3σ.
Current usage metrics show cumulative count of Article Views (full-text article views including HTML views, PDF and ePub downloads, according to the available data) and Abstracts Views on Vision4Press platform.
Data correspond to usage on the plateform after 2015. The current usage metrics is available 48-96 hours after online publication and is updated daily on week days.
Initial download of the metrics may take a while.