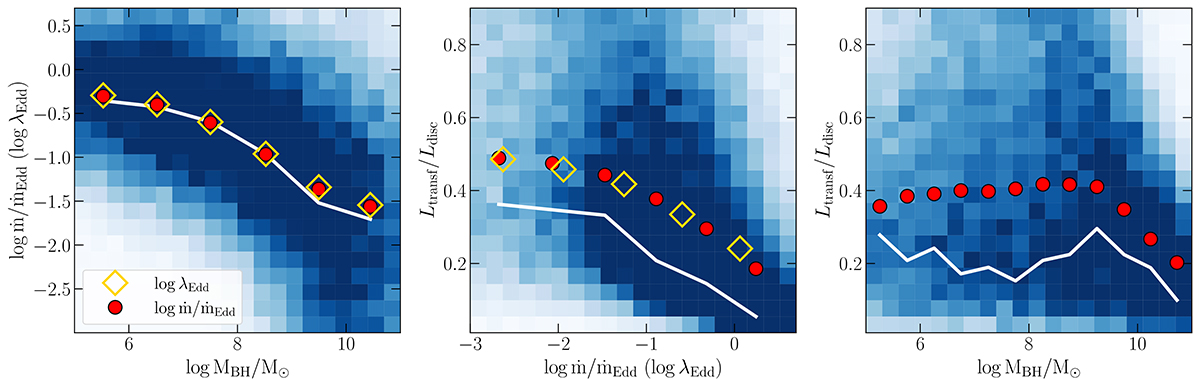
Fig. 3.
Download original image
Correlation between log ṁ/ṁEdd and log MBH, Ltransf/Ldisc and log ṁ/ṁEdd, and between Ltransf/Ldisc and log MBH (left, middle, and right panels, respectively) for the subset of model SEDs that are consistent with the observed L2 keV − L2500 Å correlation. The blue squares correspond to the 2D histograms. The red circles correspond to the median parameters in narrow bins along the x-axis. The empty diamonds show the median log λEdd, computed in the same bins. The solid white lines show the mode of the distribution in each of the bins along the x-axis.
Current usage metrics show cumulative count of Article Views (full-text article views including HTML views, PDF and ePub downloads, according to the available data) and Abstracts Views on Vision4Press platform.
Data correspond to usage on the plateform after 2015. The current usage metrics is available 48-96 hours after online publication and is updated daily on week days.
Initial download of the metrics may take a while.