Fig. 2.
Download original image
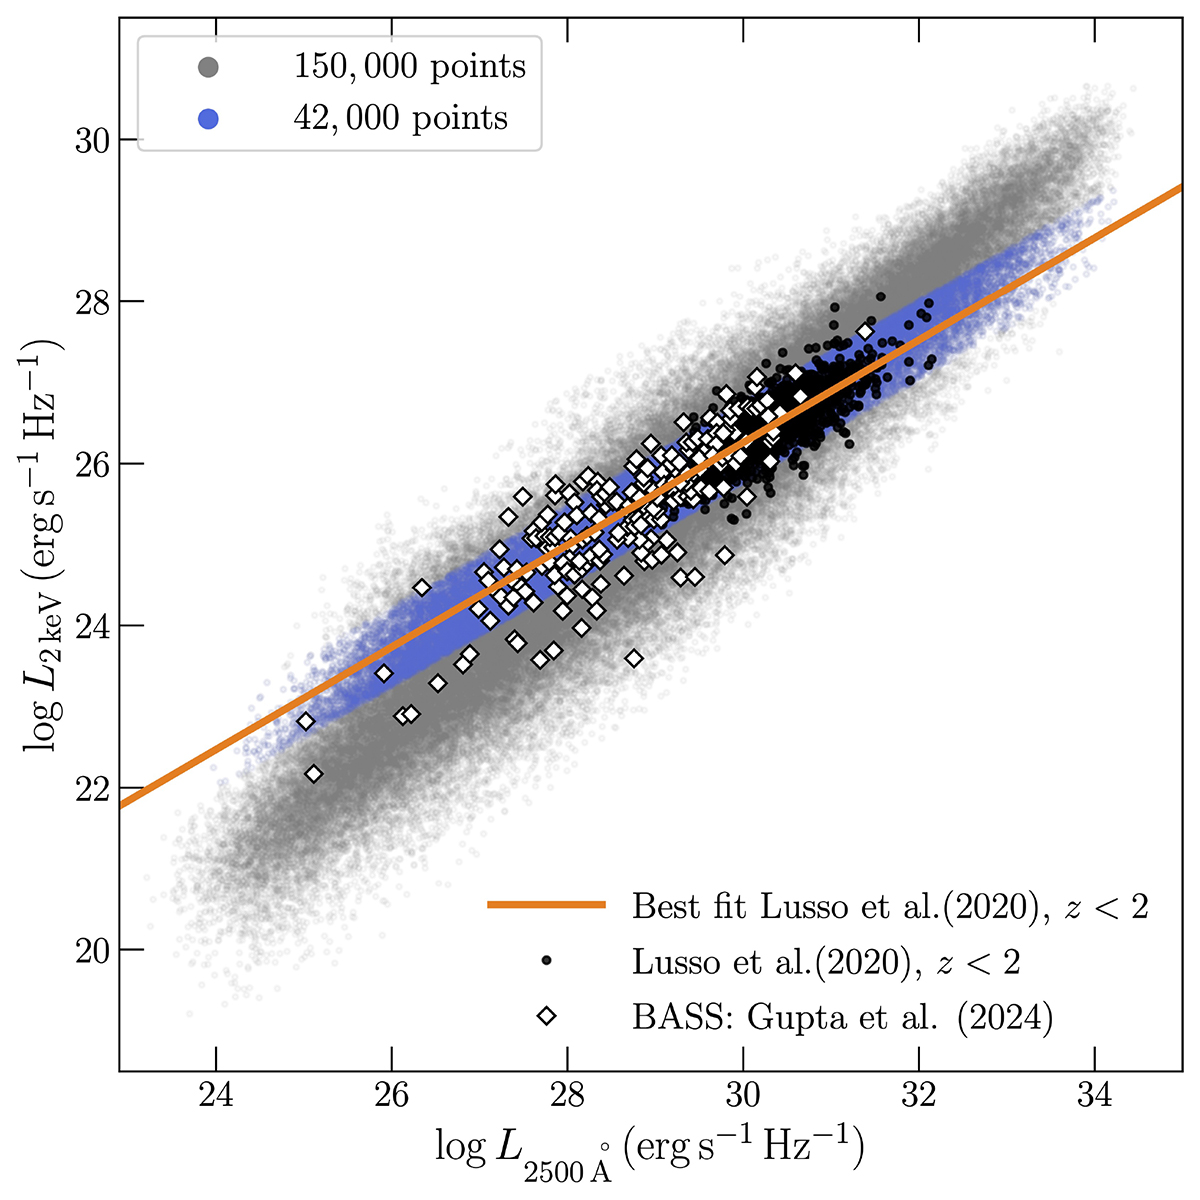
X-ray luminosity vs. UV luminosity for the full set of model SEDs for which the corona radius is physical (grey points; see Sect. 2 for more details). The black points correspond to the data obtained from Lusso et al. (2020) for quasars at a redshift below 2. The orange line shows the best-fit straight line fitted to the black points. The blue points correspond to the model SEDs that are consistent with the best-fit line within 2σ. The white diamonds indicate the data from the BASS sample (Gupta et al. 2024).
Current usage metrics show cumulative count of Article Views (full-text article views including HTML views, PDF and ePub downloads, according to the available data) and Abstracts Views on Vision4Press platform.
Data correspond to usage on the plateform after 2015. The current usage metrics is available 48-96 hours after online publication and is updated daily on week days.
Initial download of the metrics may take a while.