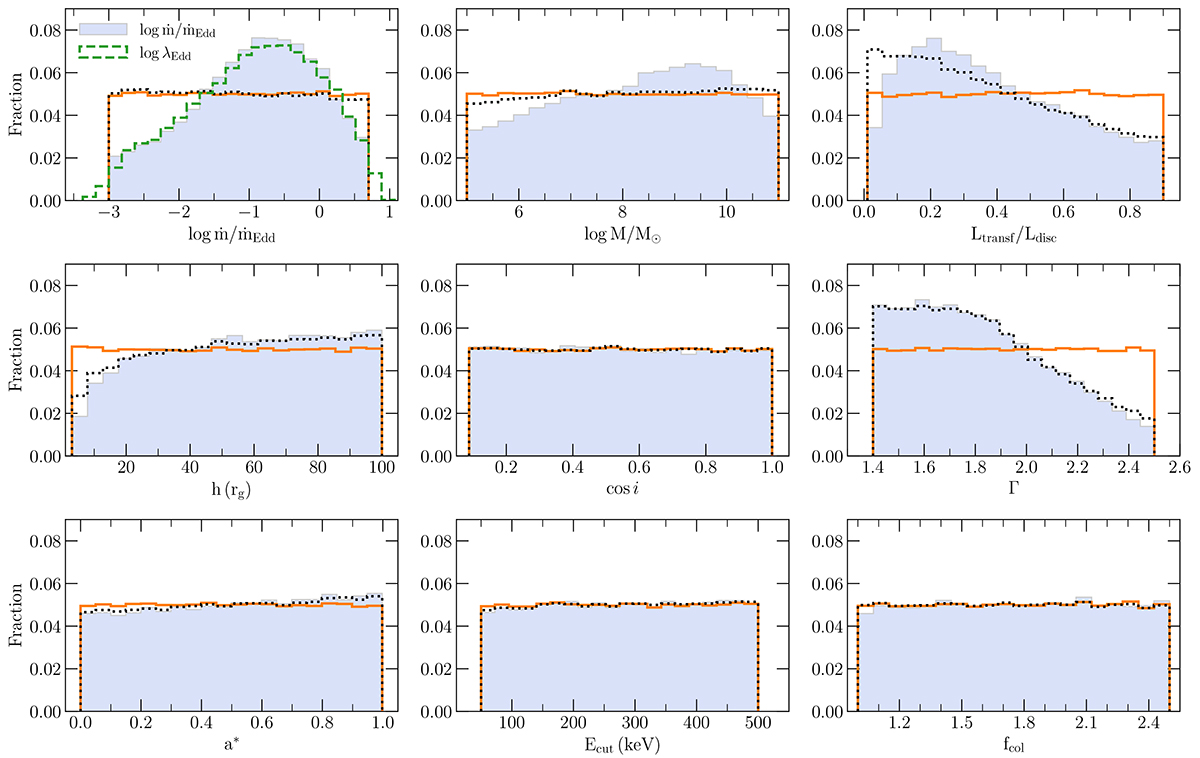
Fig. 1.
Download original image
Distribution of each of the model parameters of the full set of model SEDs (solid orange lines), the subset of SEDs for which the size of the corona is smaller than the height of the source (dotted black lines), and of the selected subset of SEDs that agree with the observed L2 keV − L2500 Å correlation (filled blue histograms). This subsample consists of 28% (42 000 SEDs) of the full set of model SEDs. The dashed green histogram in the upper left panel corresponds to the distribution of log λEdd of the selected subset of model SEDs.
Current usage metrics show cumulative count of Article Views (full-text article views including HTML views, PDF and ePub downloads, according to the available data) and Abstracts Views on Vision4Press platform.
Data correspond to usage on the plateform after 2015. The current usage metrics is available 48-96 hours after online publication and is updated daily on week days.
Initial download of the metrics may take a while.