Fig. 9
Download original image
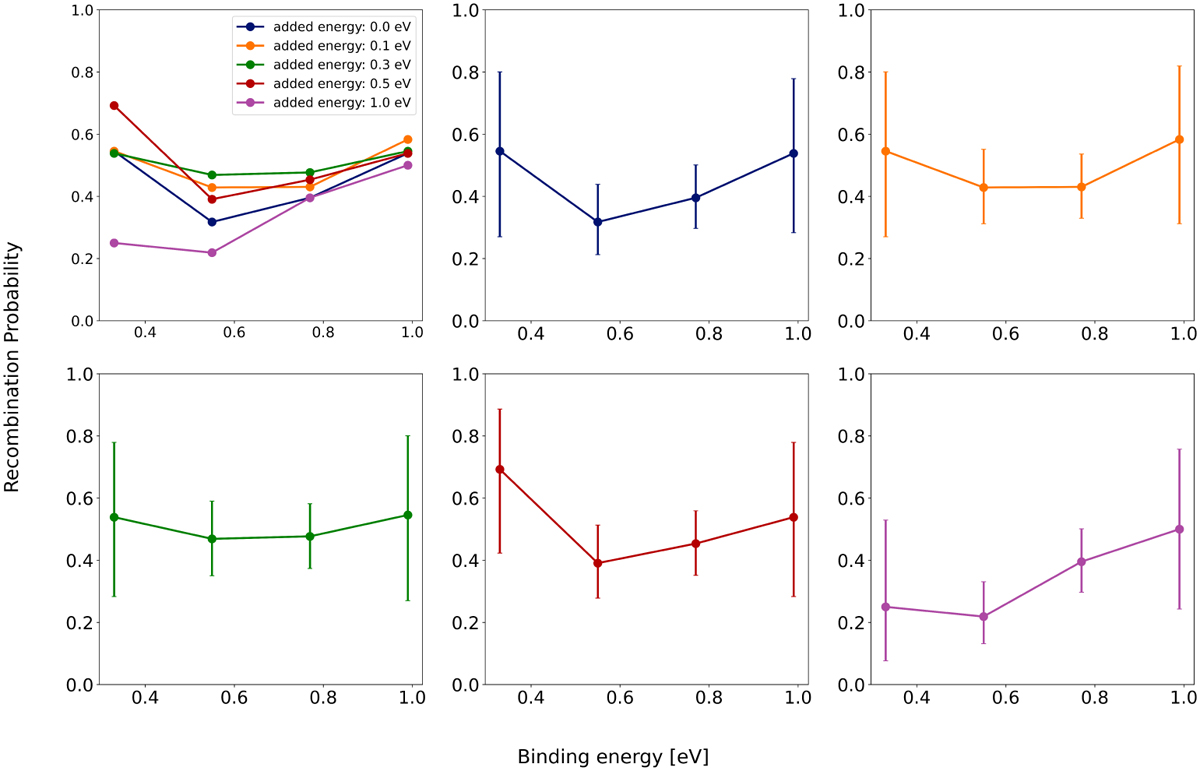
Recombination probability of hydroxyl radicals as function of binding energy of OH radical. The binding energy of the more weakly bound radical is shown on the x-axis. The first top left plot presents the results for all the energies combined. The following graphs present the datasets for different amounts of added energy individually, with the error bars included in the plots. Error bars represent Jeffreys Bayesian interval generated by Python library statsmodels (Seabold & Perktold 2010).
Current usage metrics show cumulative count of Article Views (full-text article views including HTML views, PDF and ePub downloads, according to the available data) and Abstracts Views on Vision4Press platform.
Data correspond to usage on the plateform after 2015. The current usage metrics is available 48-96 hours after online publication and is updated daily on week days.
Initial download of the metrics may take a while.