Open Access
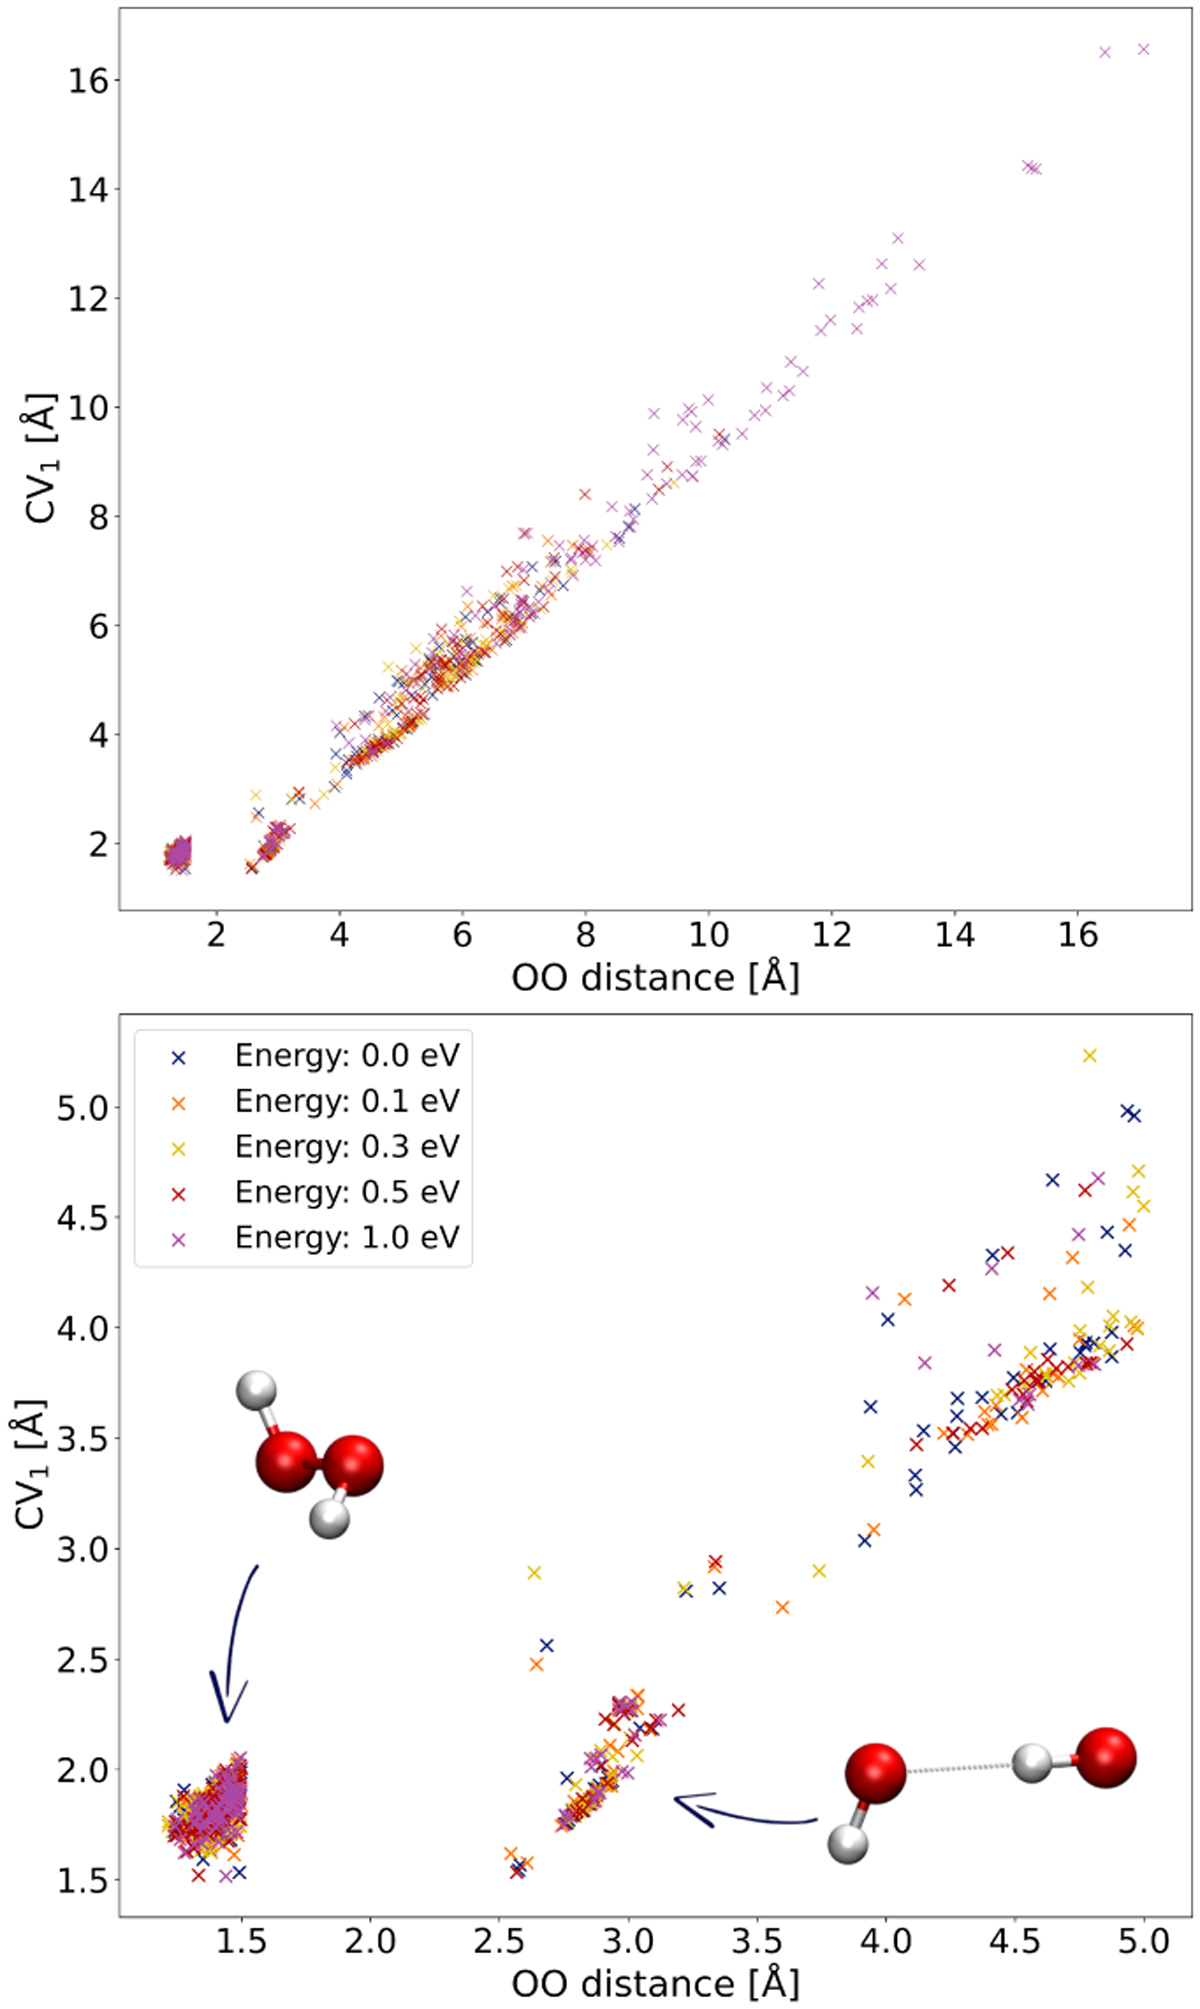
Fig. 7
Download original image
Plot of final geometries of all trajectories. The upper plot shows all endpoints of trajectories in the 2D graph of CV1 and O-O distance; the lower plot presents data from the same trajectories with a zoomed-in view of H-bonding and hydrogen-peroxide conformers.
Current usage metrics show cumulative count of Article Views (full-text article views including HTML views, PDF and ePub downloads, according to the available data) and Abstracts Views on Vision4Press platform.
Data correspond to usage on the plateform after 2015. The current usage metrics is available 48-96 hours after online publication and is updated daily on week days.
Initial download of the metrics may take a while.