Open Access
Fig. A.1
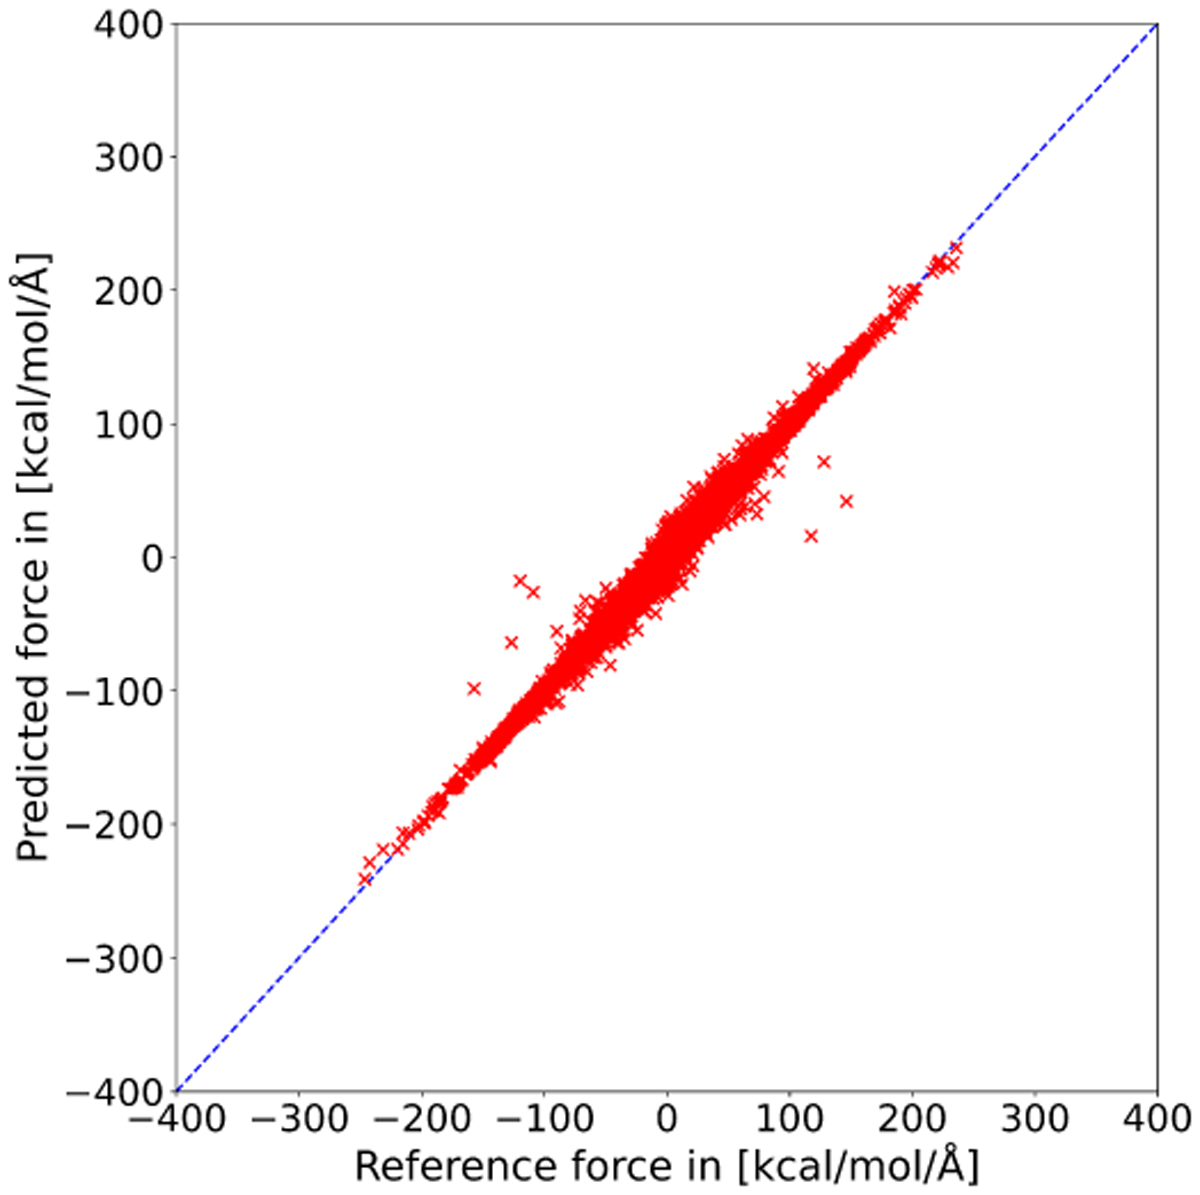
Download original image
Analysis of reference vs predicted forces for geometries from test set (part of original data set which was previously unseen by the model). The blue diagonal line is the function y = x and therefore represents perfect agreement of reference and prediction.
Current usage metrics show cumulative count of Article Views (full-text article views including HTML views, PDF and ePub downloads, according to the available data) and Abstracts Views on Vision4Press platform.
Data correspond to usage on the plateform after 2015. The current usage metrics is available 48-96 hours after online publication and is updated daily on week days.
Initial download of the metrics may take a while.