Open Access
Fig. 12
Download original image
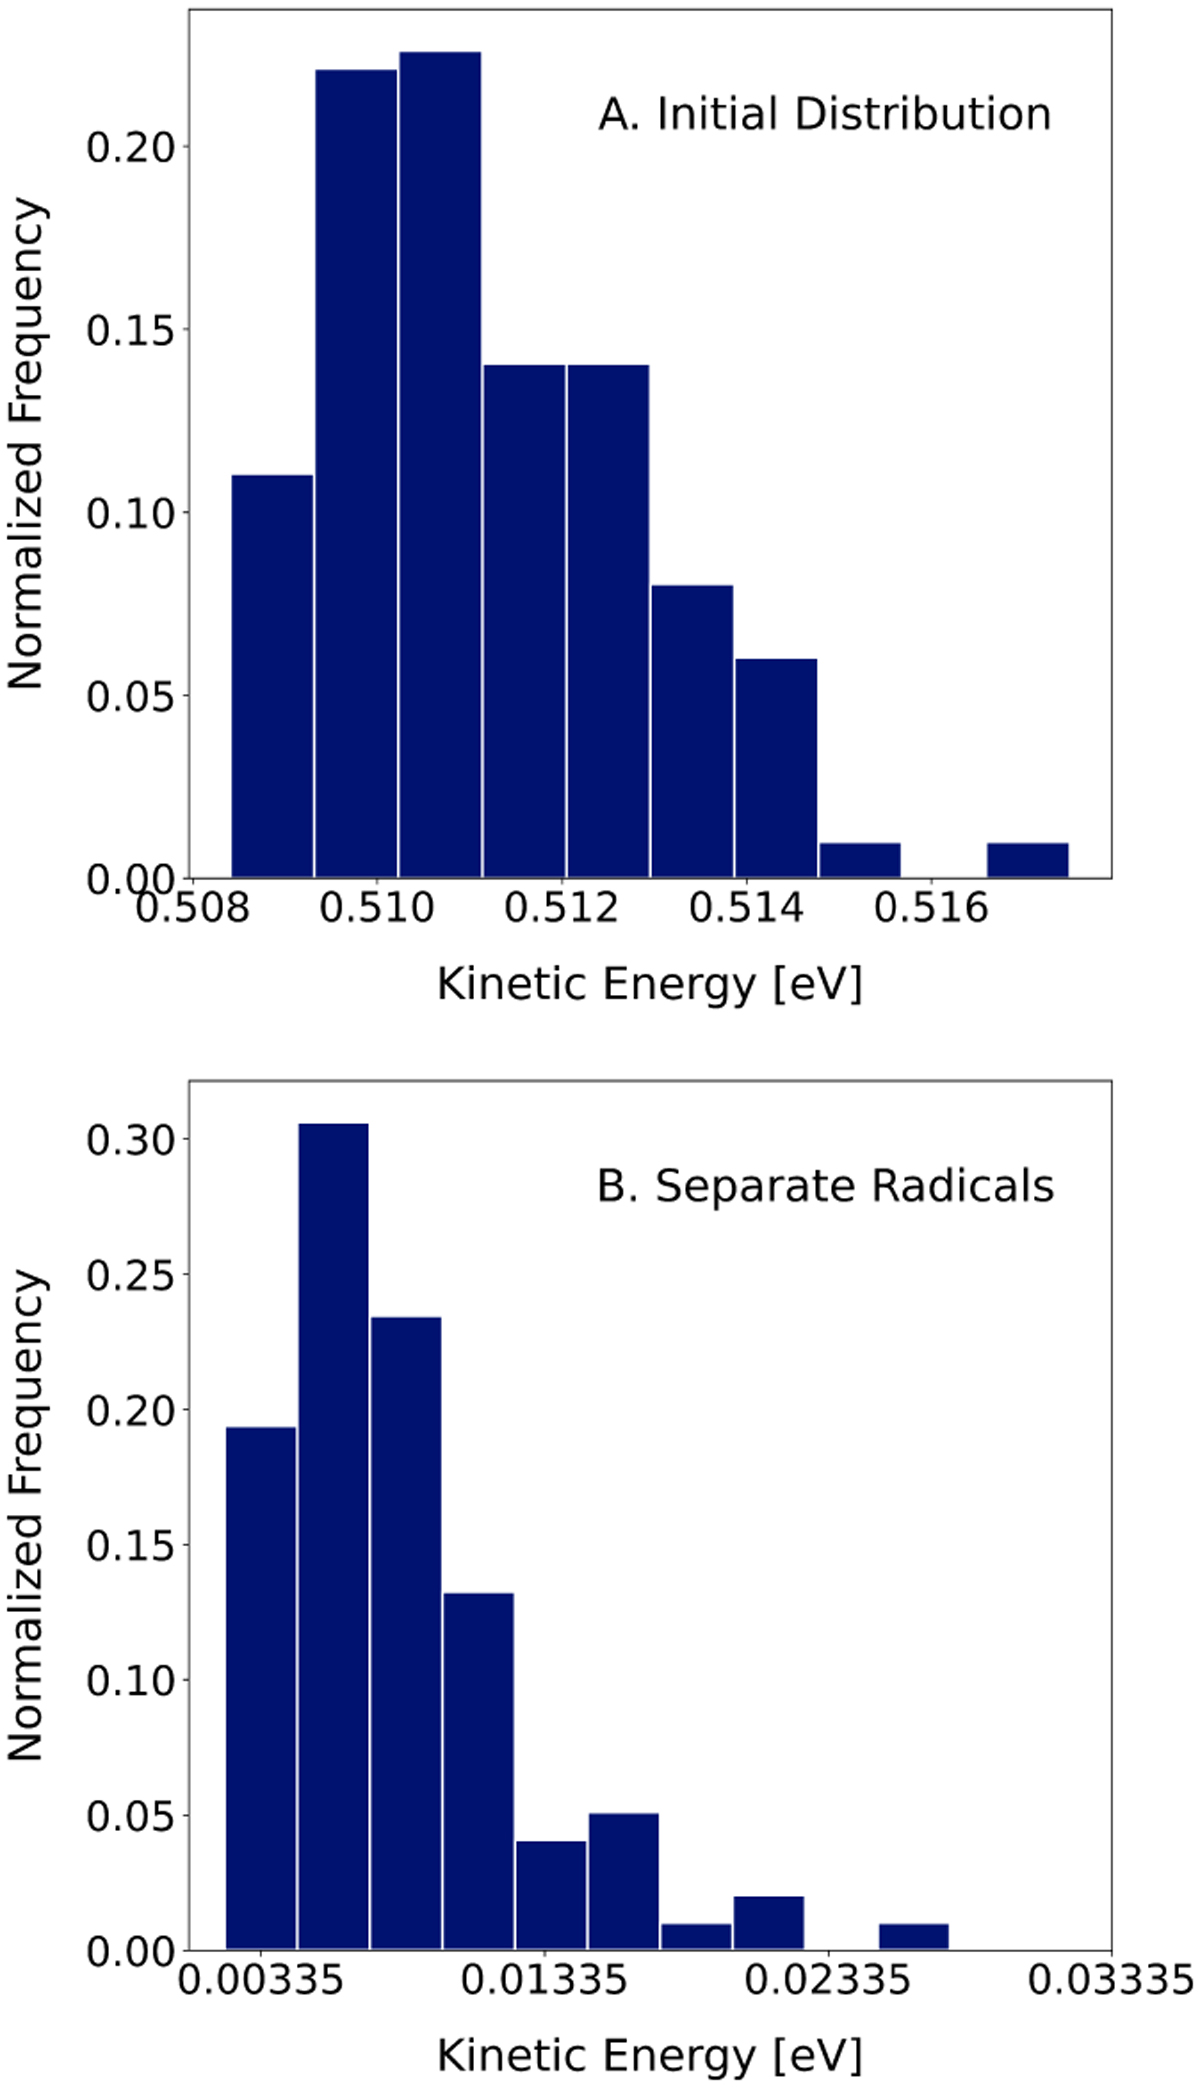
Distribution of kinetic energy for trajectories with 0.5 eV added. The upper plot shows kinetic energy for initial conditions, and the lower one gives averaged kinetic energy during the last 250 fs of MD trajectories.
Current usage metrics show cumulative count of Article Views (full-text article views including HTML views, PDF and ePub downloads, according to the available data) and Abstracts Views on Vision4Press platform.
Data correspond to usage on the plateform after 2015. The current usage metrics is available 48-96 hours after online publication and is updated daily on week days.
Initial download of the metrics may take a while.