Open Access
Fig. 10
Download original image
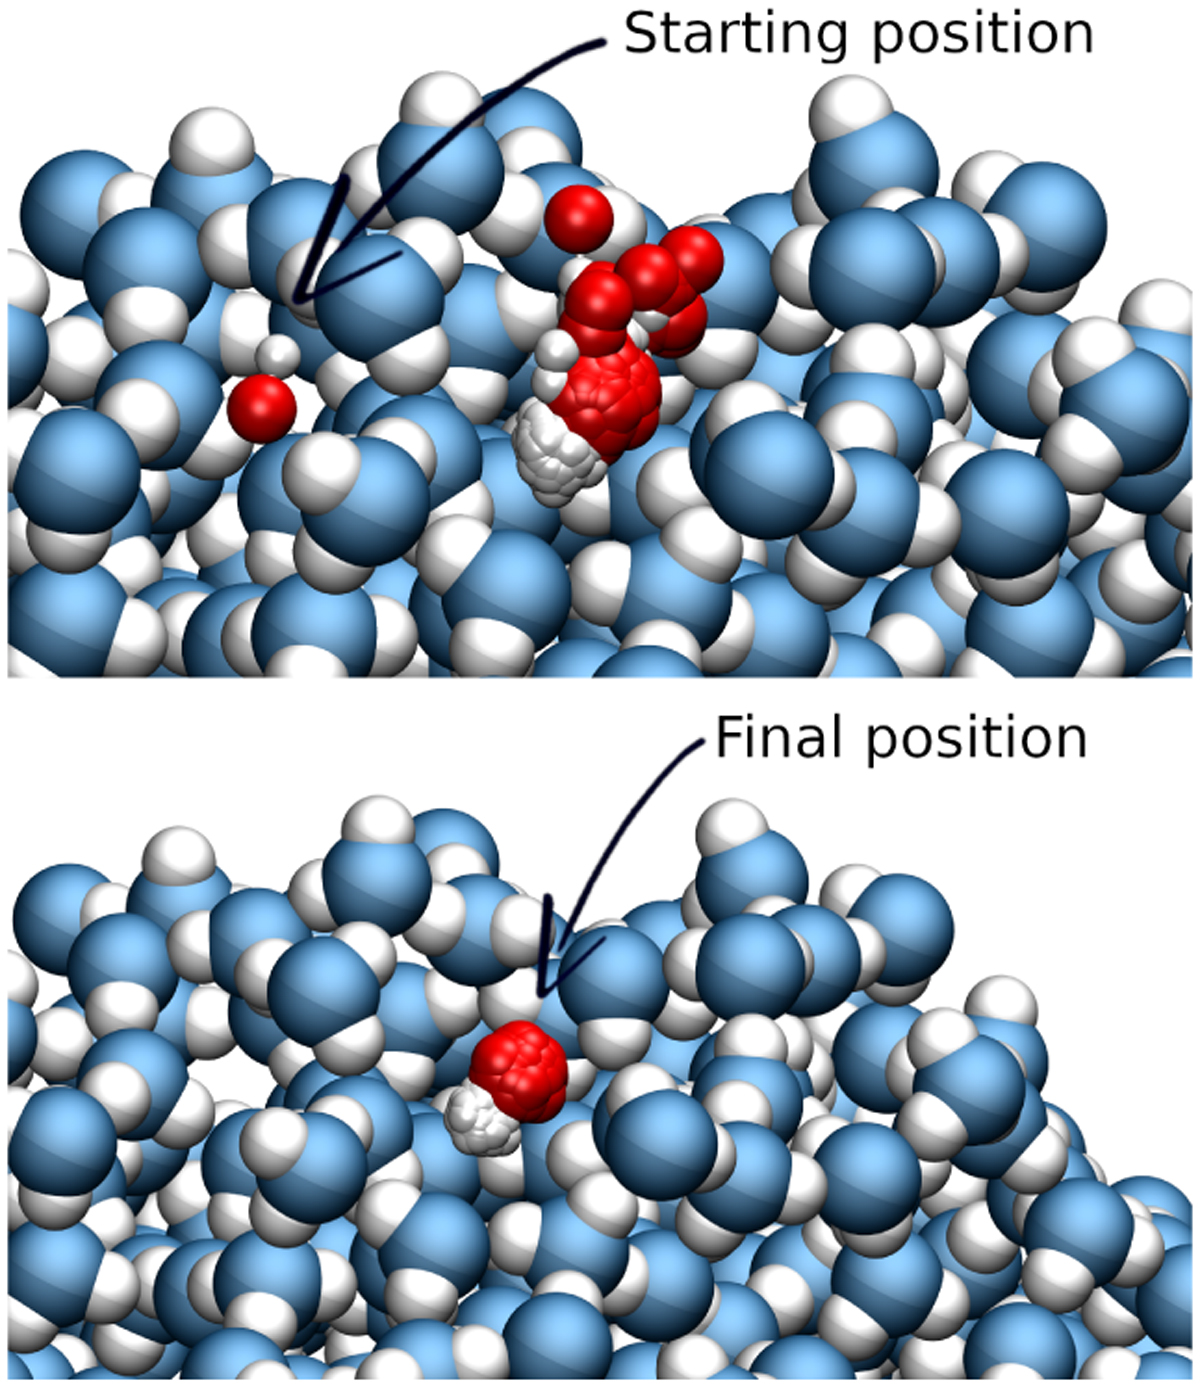
Visualisation of dynamics of OH radical on water surface after addition of 1.0 eV of additional translation energy. In the upper part of the picture, we can see all positions of the OH radical during the MD simulation. In the lower part, positions from the last nanosecond of the simulation are visualised.
Current usage metrics show cumulative count of Article Views (full-text article views including HTML views, PDF and ePub downloads, according to the available data) and Abstracts Views on Vision4Press platform.
Data correspond to usage on the plateform after 2015. The current usage metrics is available 48-96 hours after online publication and is updated daily on week days.
Initial download of the metrics may take a while.