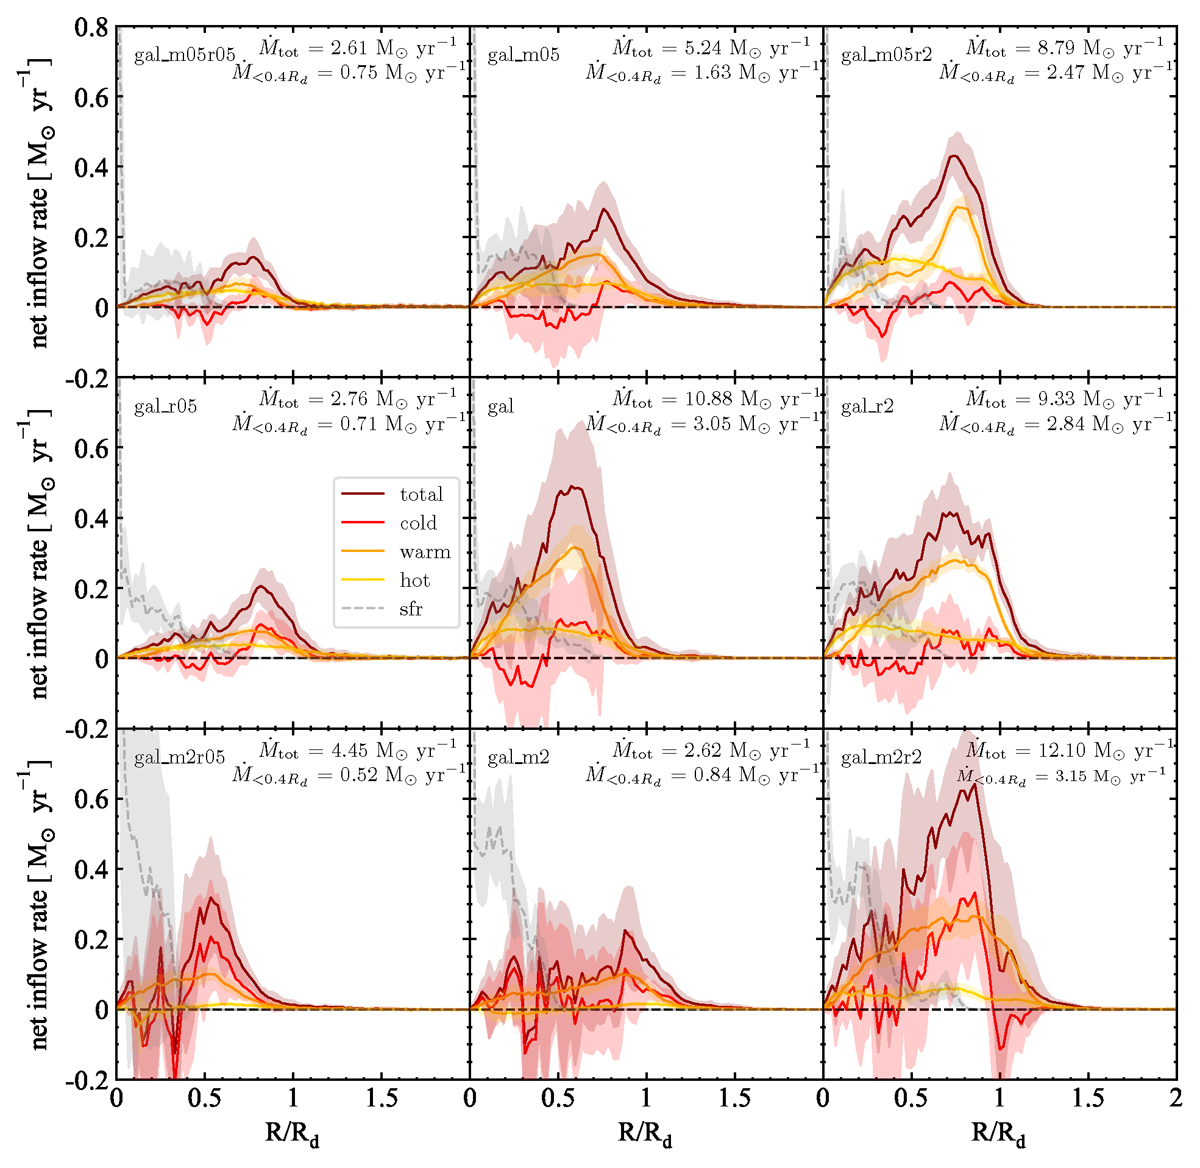
Fig. 9.
Download original image
Net vertical inflow rate, computed as Ṁnet = Ṁin−Ṁout, as a function of cylindrical radius R (in units of Rd) for the nine simulations divided in cold (T < 104 K, red line), warm (104 < T < 5 × 10⁵ K, orange line) and hot (T > 5 × 10⁵ K, yellow line) gas. The dashed grey line is the SFR profile. The solid lines represent the profile averaged over the entire simulation and the shaded areas are the standard deviations. The rates are evaluated inside a slab over the plane of the disc with a width Δz = 0.1 kpc at a height |z0| = 0.5 kpc. Each point represents the gas net inflow rate within a circular annulus with a radial width of 0.02 in R/Rd units and considering only gas cells with |vz|> vth = 30 km s−1. In each panel we have indicated the average net vertical rate at R < 0.4 Rd, this is roughly the region of the disc where 90% of the SFR is concentrated in all nine simulations. The net inflows can extend beyond Rd supplying the outer disc with fresh gas for star formation.
Current usage metrics show cumulative count of Article Views (full-text article views including HTML views, PDF and ePub downloads, according to the available data) and Abstracts Views on Vision4Press platform.
Data correspond to usage on the plateform after 2015. The current usage metrics is available 48-96 hours after online publication and is updated daily on week days.
Initial download of the metrics may take a while.