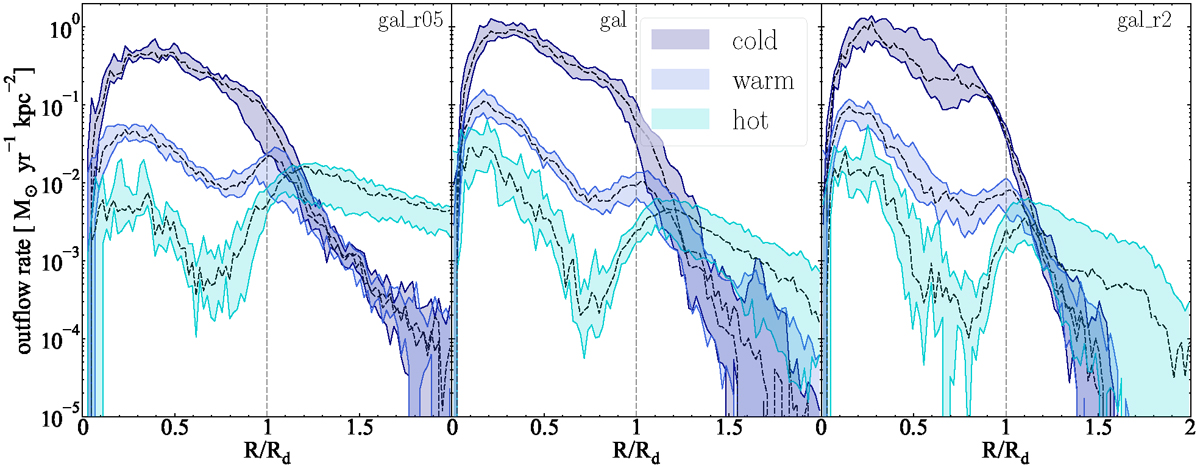
Fig. 7.
Download original image
Outflow rate per unit area as a function of the cylindrical radius, R (in units of the disc size, Rd) for gal_r05 (left panel), gal (central panel), and gal_r2 (right panel) simulations. Each shaded area indicates the outflow rate profiles between the 25th and the 75th percentile, whereas the black dashed lines represent the median values. The rates are divided in cold (T < 104 K, dark blue shaded area), warm (104 < T < 5 × 10⁵ K, blue shaded area) and hot (T > 5 × 10⁵ K, light blue shaded area) gas and computed at a height |z0| = 0.5 kpc inside a slab over the plane of the disc with a thickness Δz = 0.1 kpc and with |vz|> 30 km s−1.
Current usage metrics show cumulative count of Article Views (full-text article views including HTML views, PDF and ePub downloads, according to the available data) and Abstracts Views on Vision4Press platform.
Data correspond to usage on the plateform after 2015. The current usage metrics is available 48-96 hours after online publication and is updated daily on week days.
Initial download of the metrics may take a while.