Fig. 6.
Download original image
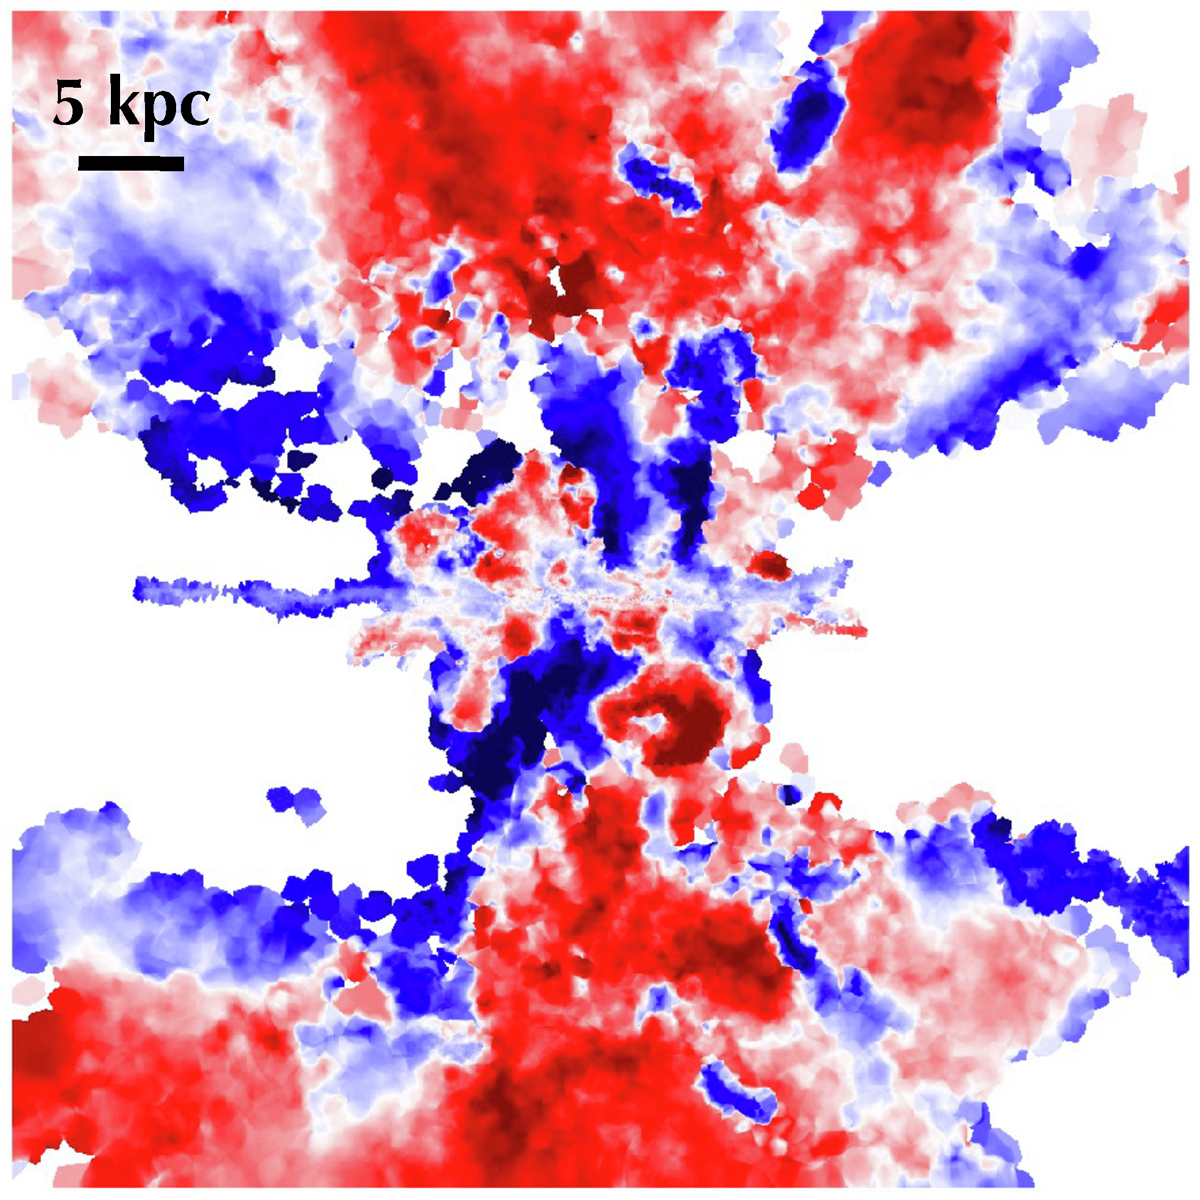
Density-weighted maps of the high-metallicity (Z > 0.9 Z⊙) gas radial velocity in edge-on projection of the gal simulation at t = 0.8 Gyr. The velocities range from −150 km s−1 (inflows, blue) to 150 km s−1 (outflows, red) as in central panel of Fig. 4. The projection clearly highlights how the accreted gas is not pristine material coming from the CGM, but is rather a mixture of the latter with gas that was previously ejected from the disc.
Current usage metrics show cumulative count of Article Views (full-text article views including HTML views, PDF and ePub downloads, according to the available data) and Abstracts Views on Vision4Press platform.
Data correspond to usage on the plateform after 2015. The current usage metrics is available 48-96 hours after online publication and is updated daily on week days.
Initial download of the metrics may take a while.