Fig. 2.
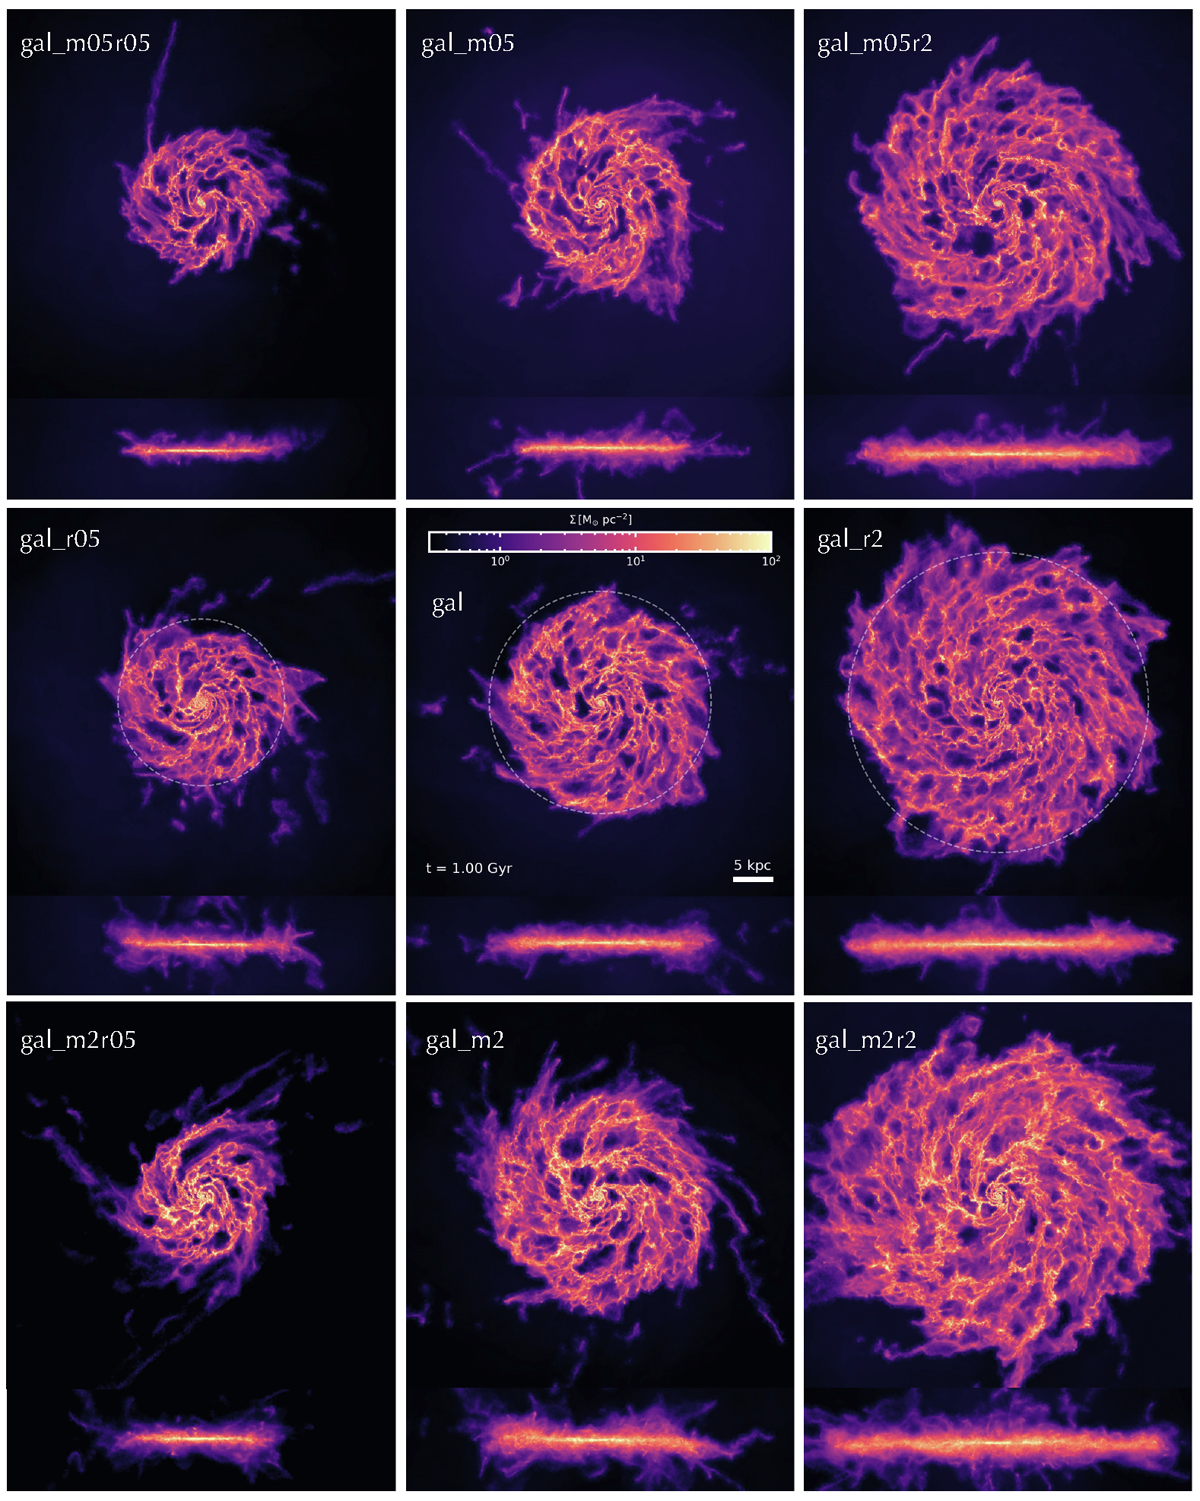
Download original image
Gas column density face-on (top panels of each row) and edge-on (bottom panels of each row) projections computed using the SMUGGLE model at t = 1 Gyr for all the nine simulations examined in this work, as labelled in each panel. The simulations differ in the initial value of the scale-length and of the mass of the gaseous disc (see Table 2). Each panel is 70 kpc across and in projection depth with a total number of 1024 × 1024 pixels that give a resolution of ∼70 pc. Brighter colours correspond to higher column densities, as indicated in the colorbar. In the gal_r05, gal and gal_r2 projection panels, the dashed white circle shows the disc size, Rd, defined as the radius at which the gas surface density drops below 1 M⊙ pc−2 (not shown in the other projections for clarity).
Current usage metrics show cumulative count of Article Views (full-text article views including HTML views, PDF and ePub downloads, according to the available data) and Abstracts Views on Vision4Press platform.
Data correspond to usage on the plateform after 2015. The current usage metrics is available 48-96 hours after online publication and is updated daily on week days.
Initial download of the metrics may take a while.