Fig. 14.
Download original image
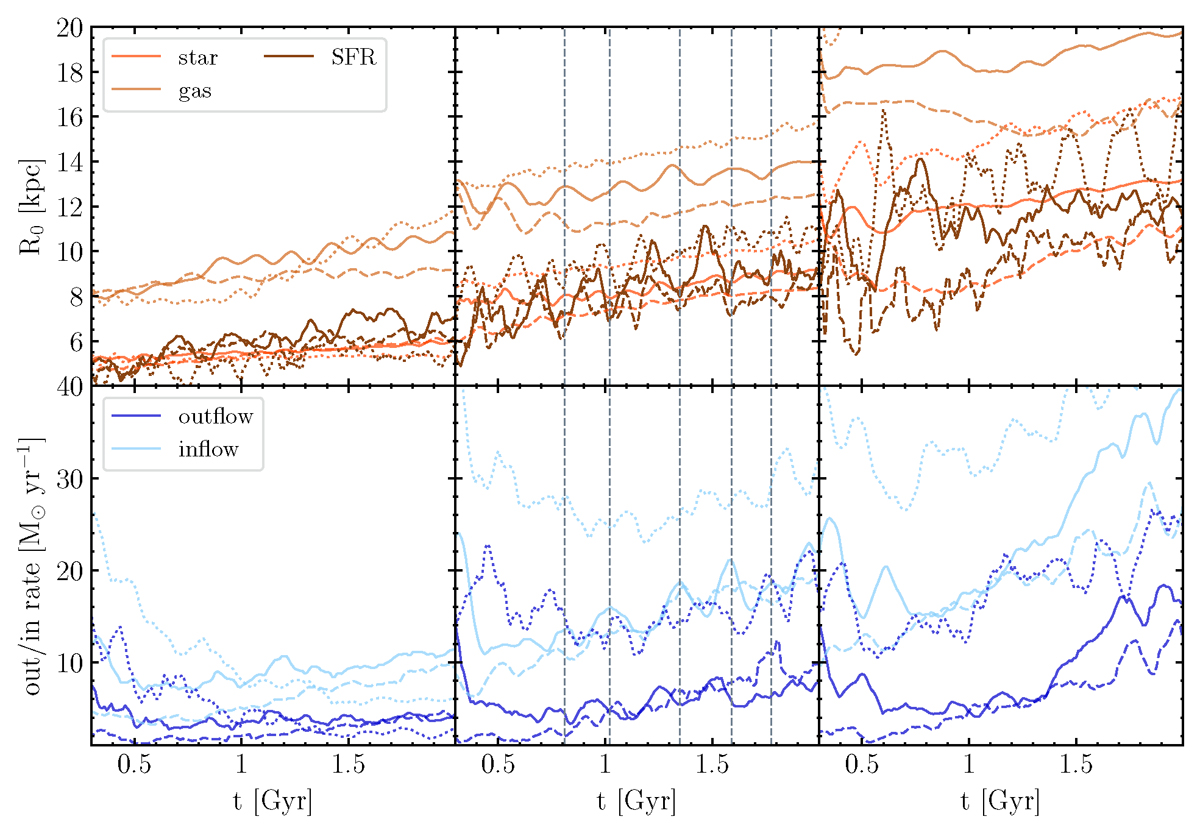
Top panels: Star (orange line), gas (light brown line), and star formation rate (brown line) scale length for the gal_r05 (solid), gal_m05r05 (dashed), gal_m2r05 (dotted, left panel), gal (solid), gal_m05 (dashed), gal_m2 (dotted, central panel), and gal_r2 (solid), gal_m05r2 (dashed), gal_m2r2 (dotted, right panel) simulations as a function of time. These scale lenghts are computed as the radius that encloses 90% of stars/gas mass or SFR. Bottom panel: total outflow (blue) and inflow (light blue) rates of the same simulations of the top panels as a function of time. The simulations with fM = 0.5 are indicated with a dashed line and the simulations with fM = 2 with a dotted line. In the central panels the peak in the inflow rate of the gal simulation are highlighted with dashed grey vertical lines. Each of the scale is connected and they have an up-and-down trend linked to the gas outflow-inflow cycle.
Current usage metrics show cumulative count of Article Views (full-text article views including HTML views, PDF and ePub downloads, according to the available data) and Abstracts Views on Vision4Press platform.
Data correspond to usage on the plateform after 2015. The current usage metrics is available 48-96 hours after online publication and is updated daily on week days.
Initial download of the metrics may take a while.