Fig. 10.
Download original image
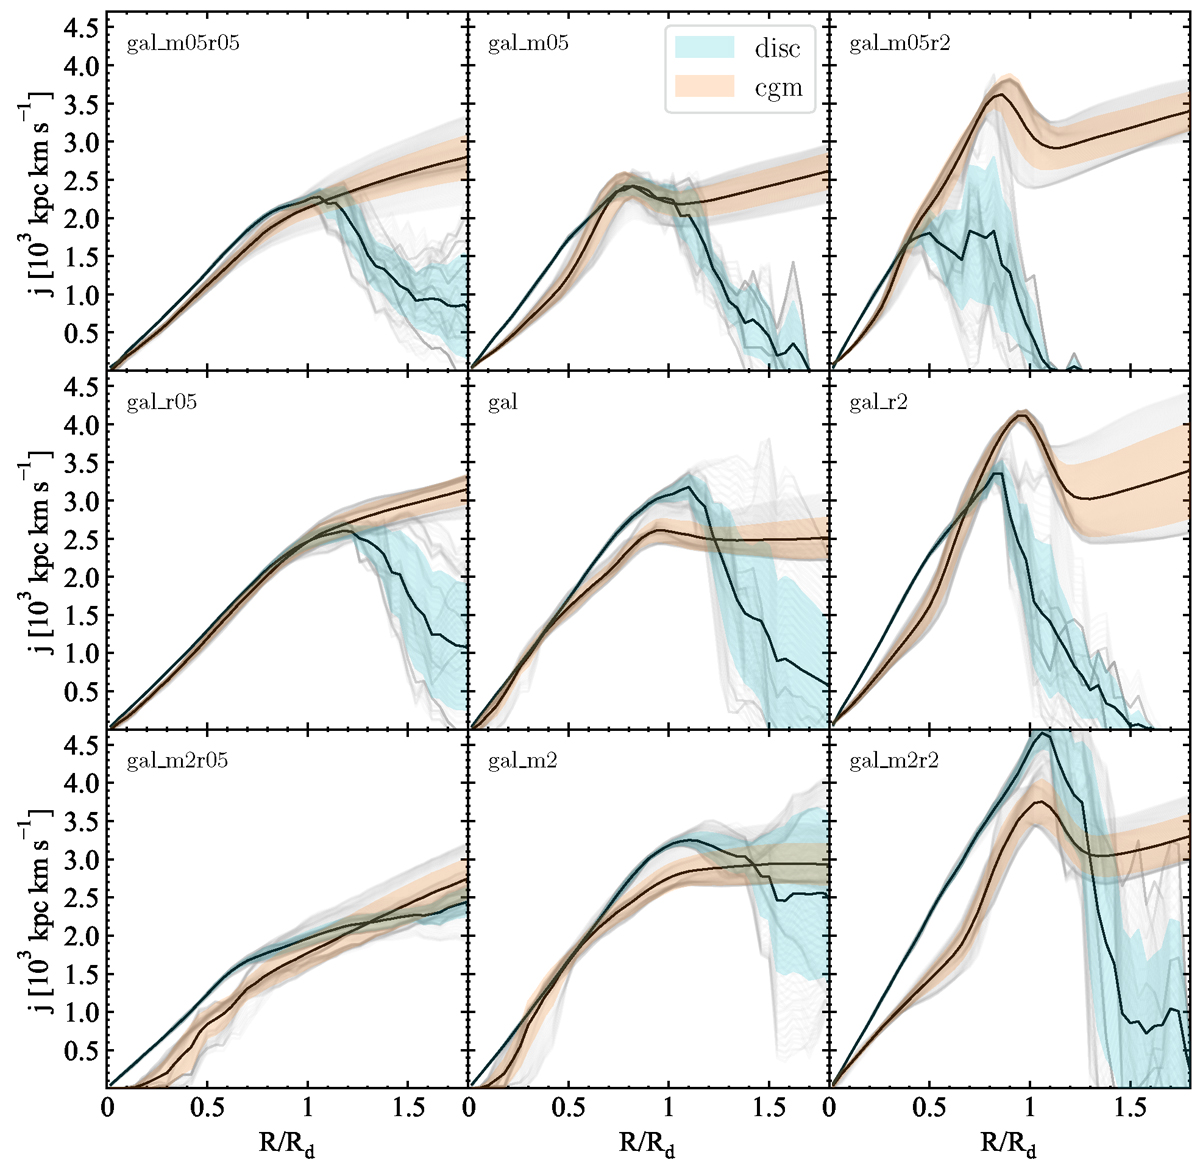
Specific angular momentum, computed as j = J/M, where J is the total angular momentum and M is the total mass of each respective component, for the gaseous disc and the CGM computed as a function of cylindrical radius R (in units of Rd) for the nine simulations. The angular momentum is measured near the disc (|z|< 1 kpc), with CGM gas selected by Z < Z⊙ and disc gas by Z ≥ Z⊙. In each panel, the grey lines represent the specific angular momentum profile at a given time averaged in a time span of 100 Myr. The black line is the average specific angular momentum and the blue (red) shaded area represents the standard deviation of the disc (CGM) specific angular momentum distribution. Each panel represents a different combination of disc mass and scale length, showing how these parameters influence the angular momentum distribution. Across all models, the disc maintains a systematically higher specific angular momentum than the CGM in the inner regions following the rotation curve, while at R/Rd ≳ 1, the disparity between the two components becomes more variable, marking the transition where the disc fades.
Current usage metrics show cumulative count of Article Views (full-text article views including HTML views, PDF and ePub downloads, according to the available data) and Abstracts Views on Vision4Press platform.
Data correspond to usage on the plateform after 2015. The current usage metrics is available 48-96 hours after online publication and is updated daily on week days.
Initial download of the metrics may take a while.