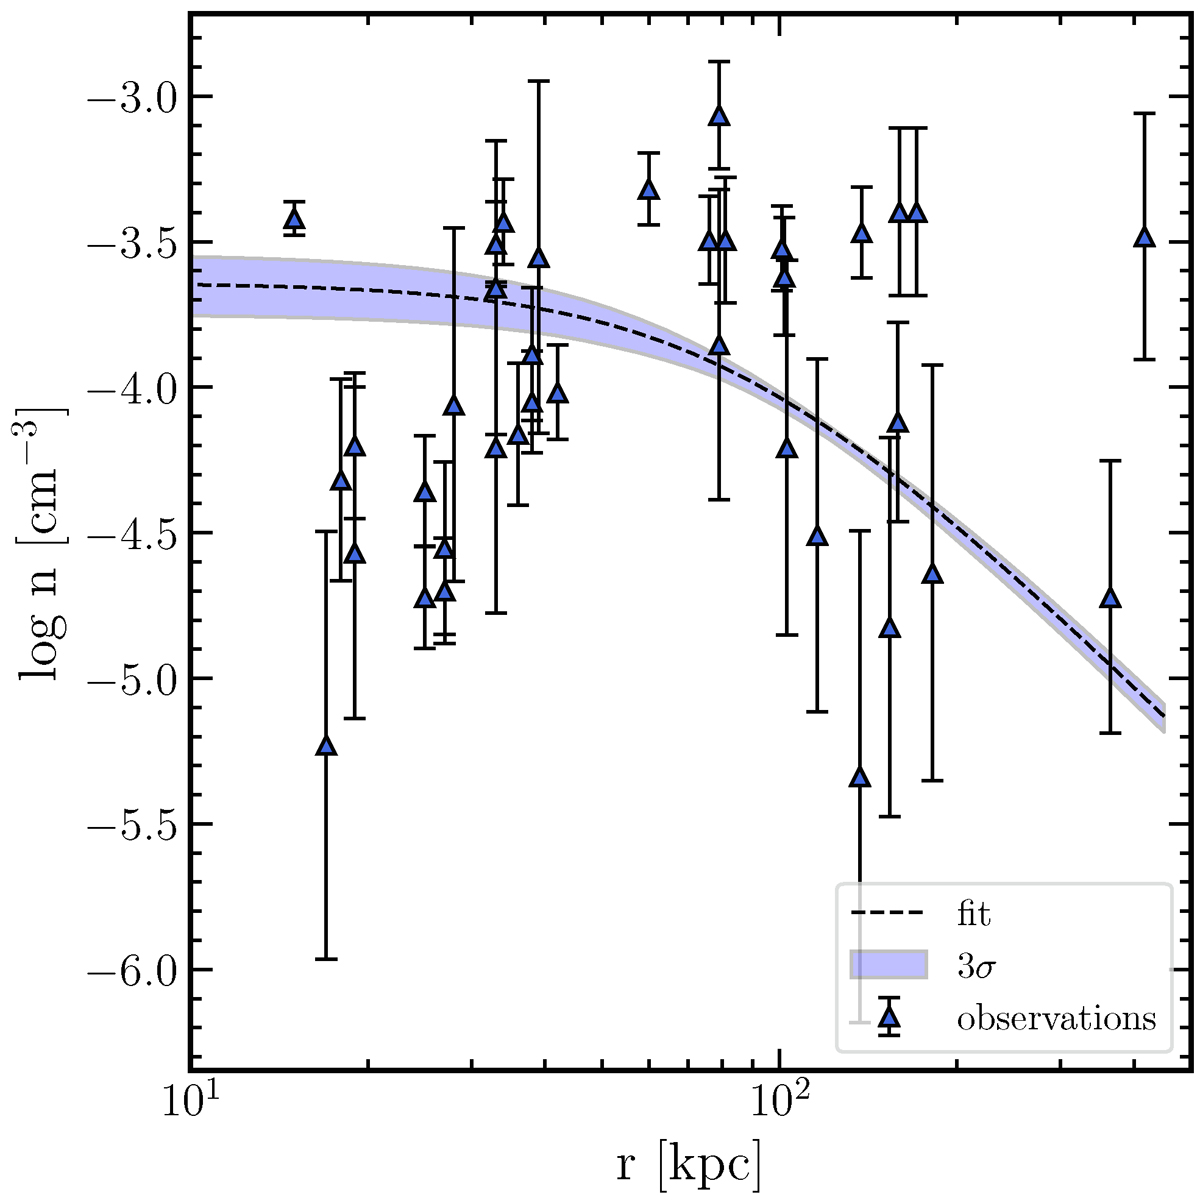
Fig. 1.
Download original image
Number density of the coronal gas as a function of radius. The black dashed line is the median model obtained by fitting a beta model to Milky Way coronal gas observations (upward pointing triangles with errorbars) using a Markov chain Monte Carlo algorithm. The coloured shaded area represents the 3σ region. Observations, which should be considered as lower limits for the coronal density, are taken from Putman et al. (2021).
Current usage metrics show cumulative count of Article Views (full-text article views including HTML views, PDF and ePub downloads, according to the available data) and Abstracts Views on Vision4Press platform.
Data correspond to usage on the plateform after 2015. The current usage metrics is available 48-96 hours after online publication and is updated daily on week days.
Initial download of the metrics may take a while.