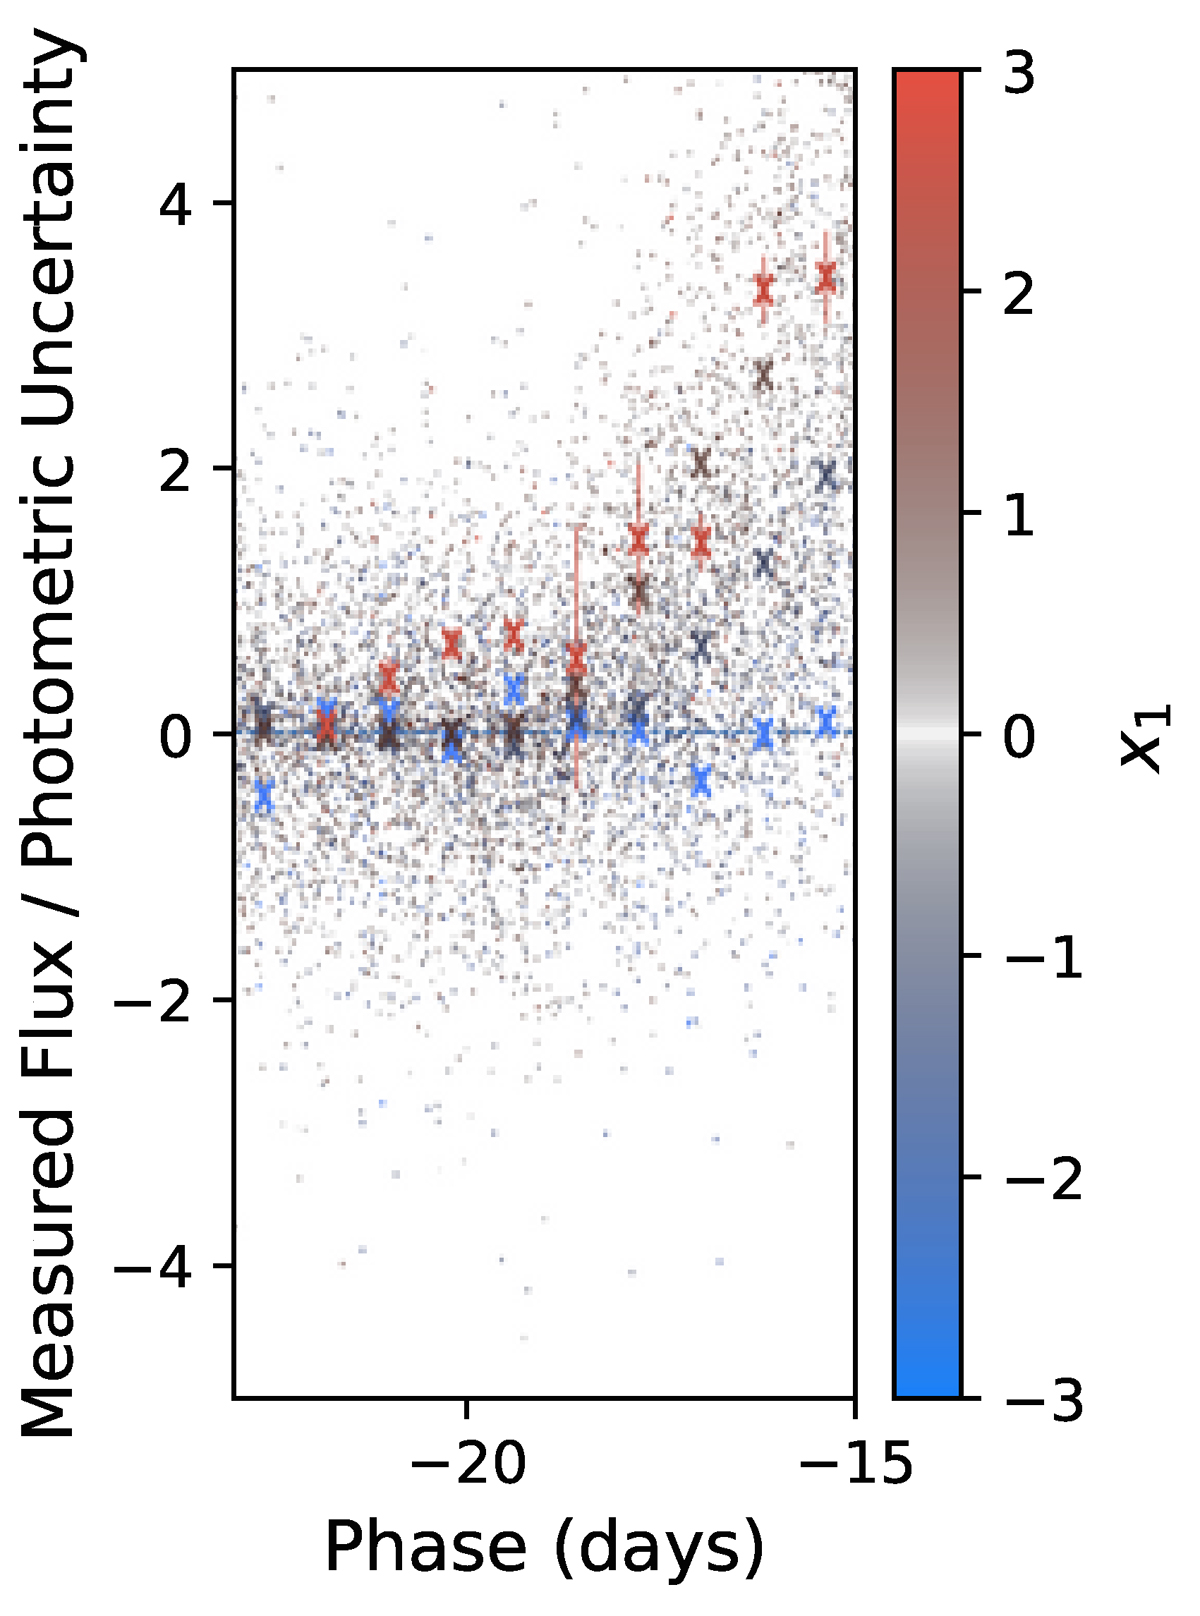
Fig. 4.

Download original image
Early time photometric fluxes, relative to photometric uncertainties, in the expanded training sample. Each point is a single photometric measurement, colored according to the x1 value of the supernova it belongs to. Crosses show mean values binned by both x1 and phase. Negative flux measurements are possible due to measurement uncertainties in difference imaging/scene modelling. Observations of SNe with x1 values close to the center of the distribution have been made partially transparent, to emphasize the edges of the population. PS1MD and Foundation data have been excluded from this plot, as some residuals showed indications of image subtraction issues.
Current usage metrics show cumulative count of Article Views (full-text article views including HTML views, PDF and ePub downloads, according to the available data) and Abstracts Views on Vision4Press platform.
Data correspond to usage on the plateform after 2015. The current usage metrics is available 48-96 hours after online publication and is updated daily on week days.
Initial download of the metrics may take a while.


