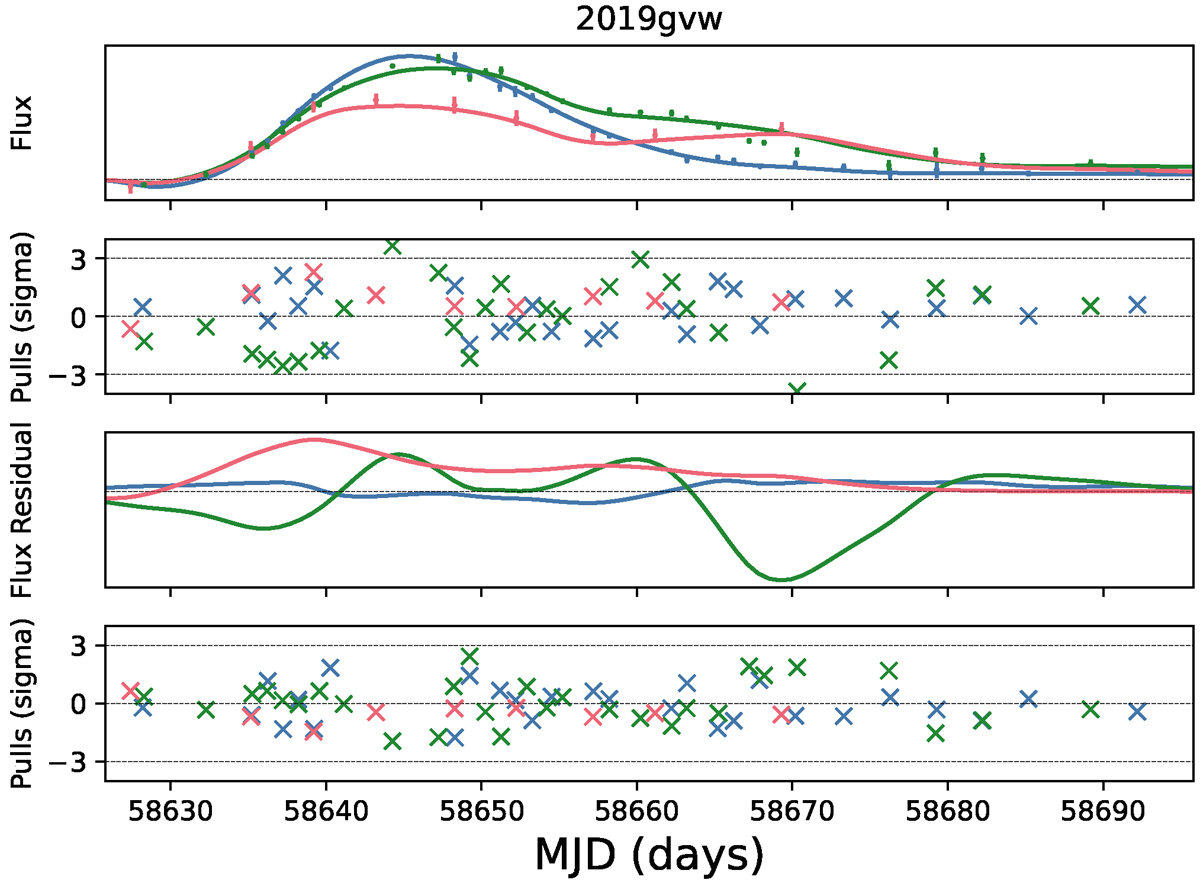
Fig. 3.
Download original image
Illustration of the Gaussian process inference described in Section 2.3 as applied to the light curve of 2019gvw. First panel: SALT2 fit to the light curve, along with observations (binned to 1 day resolution). Second panel: residuals of SALT2 fit. These residuals show both correlated behavior and uncorrelated noise. Third panel: Gaussian process, conditioned on observed residuals, with hyperparameters from Table 1, showing the possible correlated structure we ultimately hope to include in the trained SALT model. Fourth panel: leave-one-out residuals from Gaussian process, showing expected scatter and reduced correlation.
Current usage metrics show cumulative count of Article Views (full-text article views including HTML views, PDF and ePub downloads, according to the available data) and Abstracts Views on Vision4Press platform.
Data correspond to usage on the plateform after 2015. The current usage metrics is available 48-96 hours after online publication and is updated daily on week days.
Initial download of the metrics may take a while.