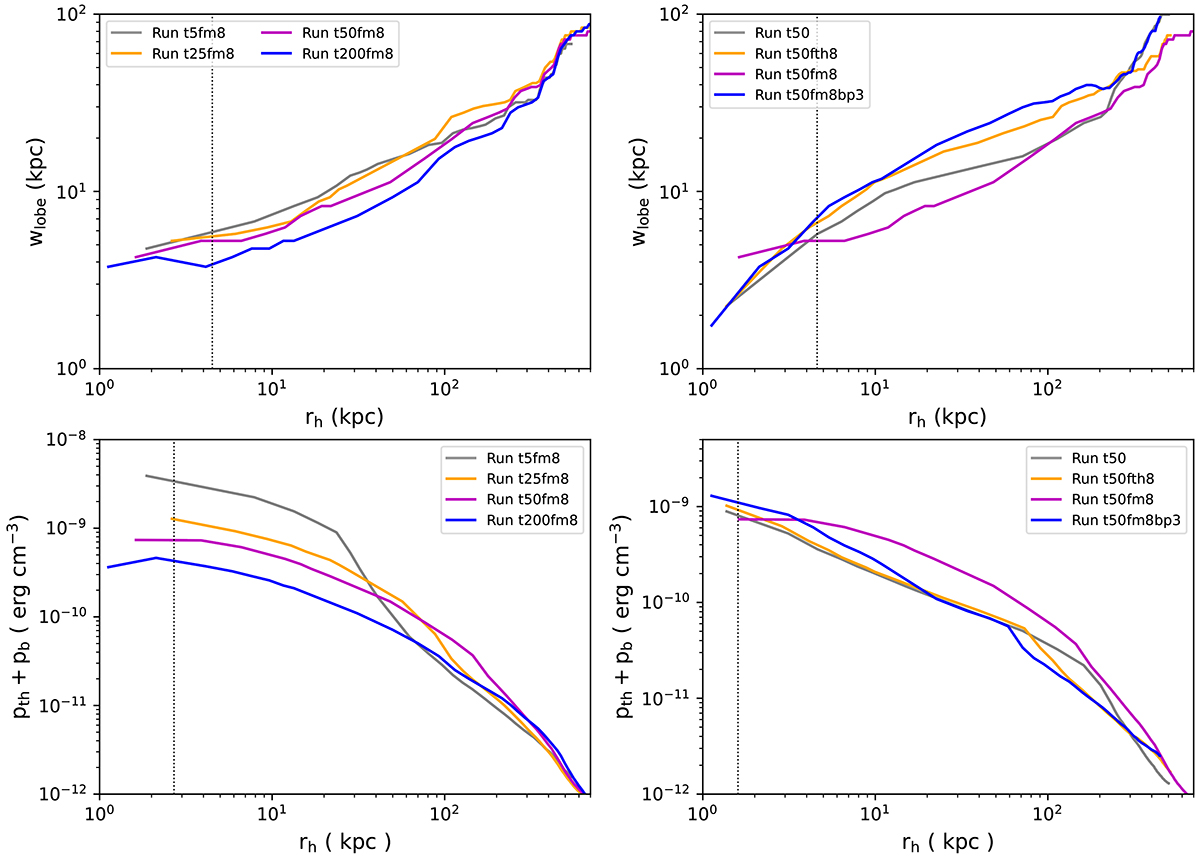
Fig. 7.
Download original image
Width (upper panels) and volume-averaged internal pressure (including thermal and magnetic pressure; lower panels) of jetted bubbles varying with the traveling distance of the heads of bubbles in the two sets of runs discussed in Sects. 4.1 and 4.2. Different line colors represent different runs. The vertical lines denote the points where anticorrelations between the width (or pressure) and the final scales of the radio sources are beginning to develop.
Current usage metrics show cumulative count of Article Views (full-text article views including HTML views, PDF and ePub downloads, according to the available data) and Abstracts Views on Vision4Press platform.
Data correspond to usage on the plateform after 2015. The current usage metrics is available 48-96 hours after online publication and is updated daily on week days.
Initial download of the metrics may take a while.