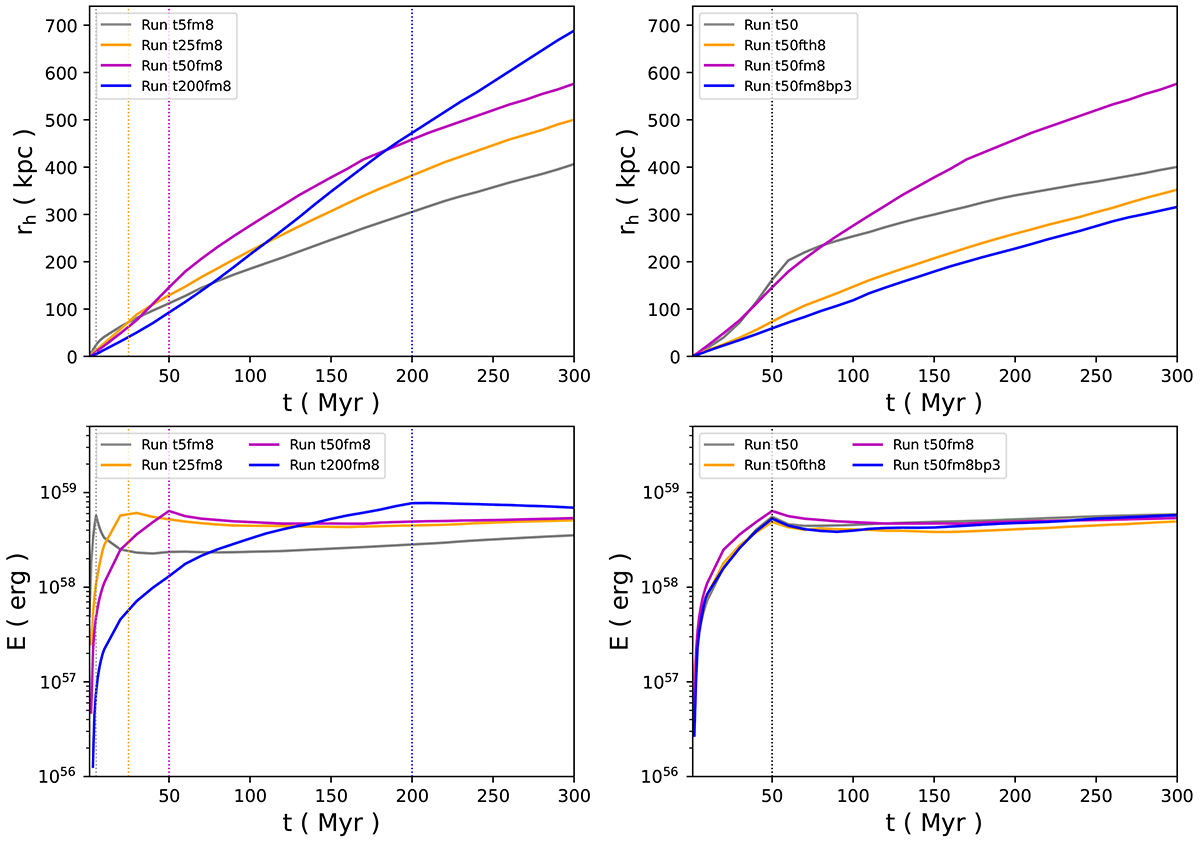
Fig. 5.
Download original image
Evolution of the traveling distance of the heads of bubbles (upper panels) and the energy contained within the jetted bubbles (lower panels) in the two sets of runs discussed in Sects. 4.1 and 4.2. The bubble region is identified by a density lower than 5 × 10⁻²⁷ g cm−3 and a toroidal magnetic field stronger than 10−9 G. The subsequent mixing between the bubble region and the ambient gas can result in an upward trend in the energy curves. Different line colors represent different runs. The vertical lines denote when the jets are shut off.
Current usage metrics show cumulative count of Article Views (full-text article views including HTML views, PDF and ePub downloads, according to the available data) and Abstracts Views on Vision4Press platform.
Data correspond to usage on the plateform after 2015. The current usage metrics is available 48-96 hours after online publication and is updated daily on week days.
Initial download of the metrics may take a while.