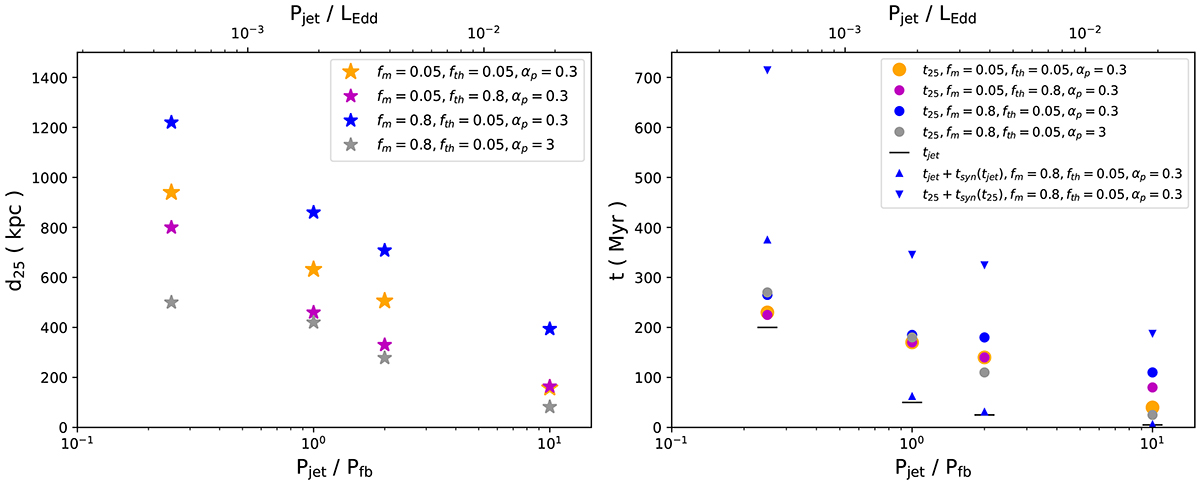
Fig. 2.
Download original image
Scales of the radio sources, d25, at the radio power 1025 W Hz−1 (left) and the corresponding times (right), varying with the jet powers, Pjet, in simulations with diverse jet parameters, as listed in Table 1. The dots in the right panel represent the time t25 when the radio power of the source declines to 1025 W Hz−1. The horizontal lines in the right panel mark the time when the corresponding jet stops being powered, tjet. The triangles denote tjet + tsyn(tjet) (upward) and t25 + tsyn(t25) (downward), where tsyn(t) is the typical synchrotron cooling time at 144(1 + z) MHz for the volume-averaged magnetic field strength corresponding to the time t calculated using Eq. (C.11). The jet powers are normalized by the typical feedback power (bottom) and Eddington luminosity (top), as discussed in Sect. 2.3. The stars are color-coded to represent distinct fractions of energy components and the magnetic structure parameter, αp.
Current usage metrics show cumulative count of Article Views (full-text article views including HTML views, PDF and ePub downloads, according to the available data) and Abstracts Views on Vision4Press platform.
Data correspond to usage on the plateform after 2015. The current usage metrics is available 48-96 hours after online publication and is updated daily on week days.
Initial download of the metrics may take a while.