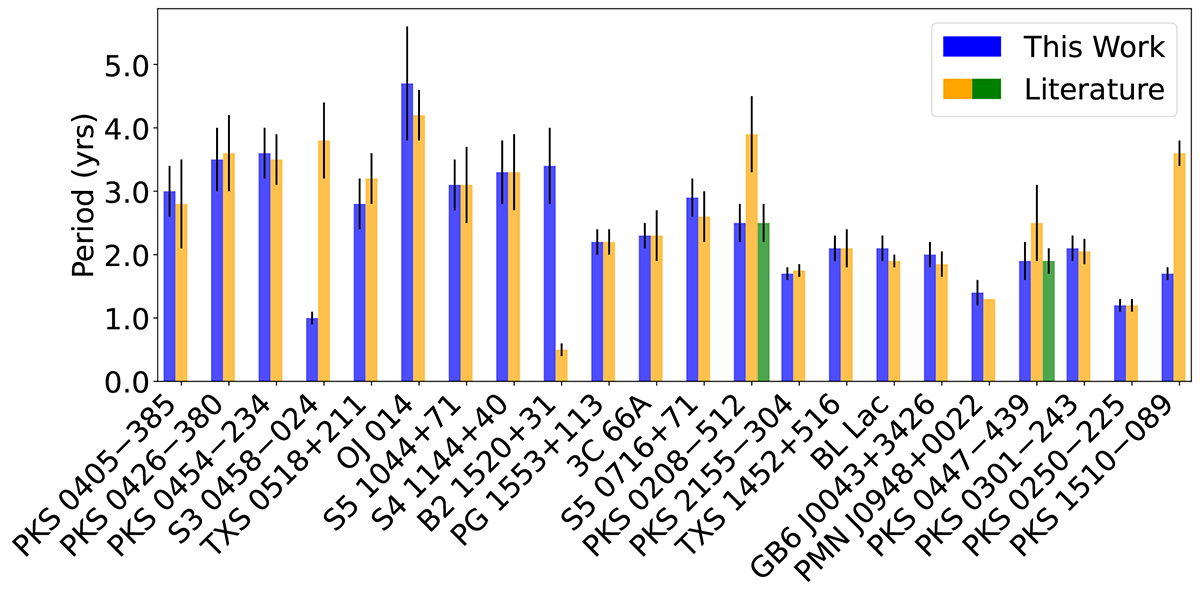
Fig. 8.
Download original image
Periodicity results using SSA compared with those reported in the literature, as summarized in Table A.2. Blue bars represent SSA results from this work, while orange and green bars represent periodicity values reported in the literature. Orange bars indicate periodicity values from individual studies, while green bars are added when other studies report additional periodicity values for the same blazar. Error bars indicate the uncertainties associated with each period.
Current usage metrics show cumulative count of Article Views (full-text article views including HTML views, PDF and ePub downloads, according to the available data) and Abstracts Views on Vision4Press platform.
Data correspond to usage on the plateform after 2015. The current usage metrics is available 48-96 hours after online publication and is updated daily on week days.
Initial download of the metrics may take a while.