Fig. 4.
Download original image
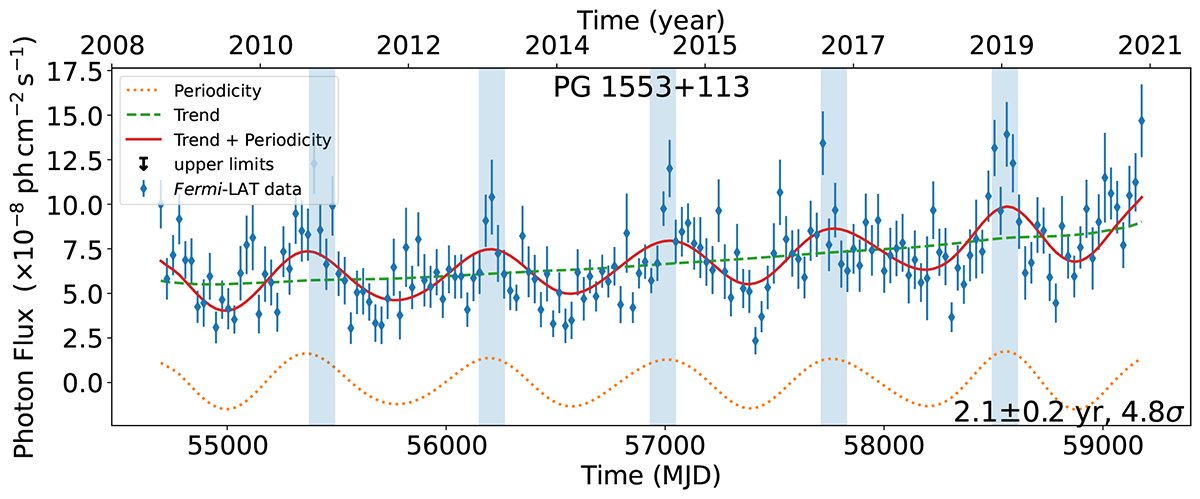
SSA applied to PG 1553+113. Blue dots represent the original signal with error bars. Orange, green, and red lines correspond to the periodicity component, the trend, and the sum of the trend and the periodicity reported by the SSA algorithm, respectively. The spacing between the blue bars indicates the period computed through the LSP (2.2 yr). The width of the blue bars is the period uncertainty (0.2 yr) computed from the FWHM of the period peak in the LSP.
Current usage metrics show cumulative count of Article Views (full-text article views including HTML views, PDF and ePub downloads, according to the available data) and Abstracts Views on Vision4Press platform.
Data correspond to usage on the plateform after 2015. The current usage metrics is available 48-96 hours after online publication and is updated daily on week days.
Initial download of the metrics may take a while.