Fig. 4.
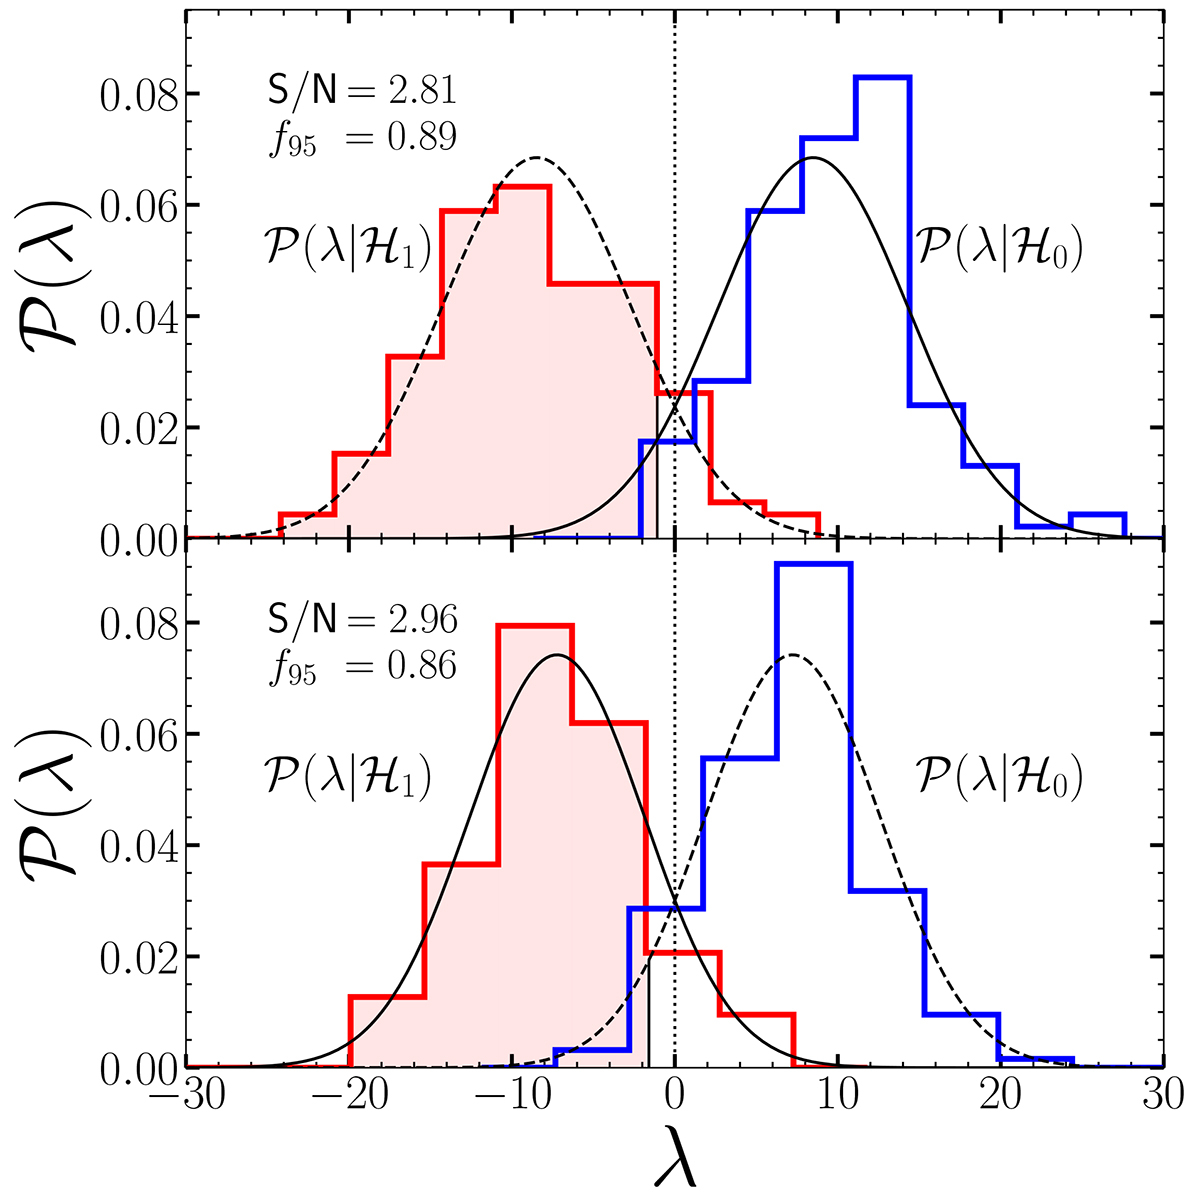
Download original image
Elucidatory example of the statistical test outlined in Sect. 4. In the top panel, the blue histogram on the right-hand side shows the distribution of the likelihood-ratio test statistic λ evaluated from the mock catalogues that do not include all relativistic RSDs (i.e. under the null hypothesis, ℋ0, which we try to rule out using the observed data). The red histogram on the left-hand side, instead, displays the distribution of λ in the mock light cones that account for all effects (i.e. under the alternative hypothesis, ℋ1). The solid and dashed curves represent Gaussian models for the histograms, as is described in the main text. The S/N is a measure of the separation between the two histograms in units of their RMS scatter. The shaded region highlights the realisations in which ℋ0 is ruled out at the 95% confidence level. The bottom panel only differs from the top one in the fact that the covariance matrix C𝒪 has been used to compute all likelihood functions. We use this approximation in the remainder of this paper.
Current usage metrics show cumulative count of Article Views (full-text article views including HTML views, PDF and ePub downloads, according to the available data) and Abstracts Views on Vision4Press platform.
Data correspond to usage on the plateform after 2015. The current usage metrics is available 48-96 hours after online publication and is updated daily on week days.
Initial download of the metrics may take a while.