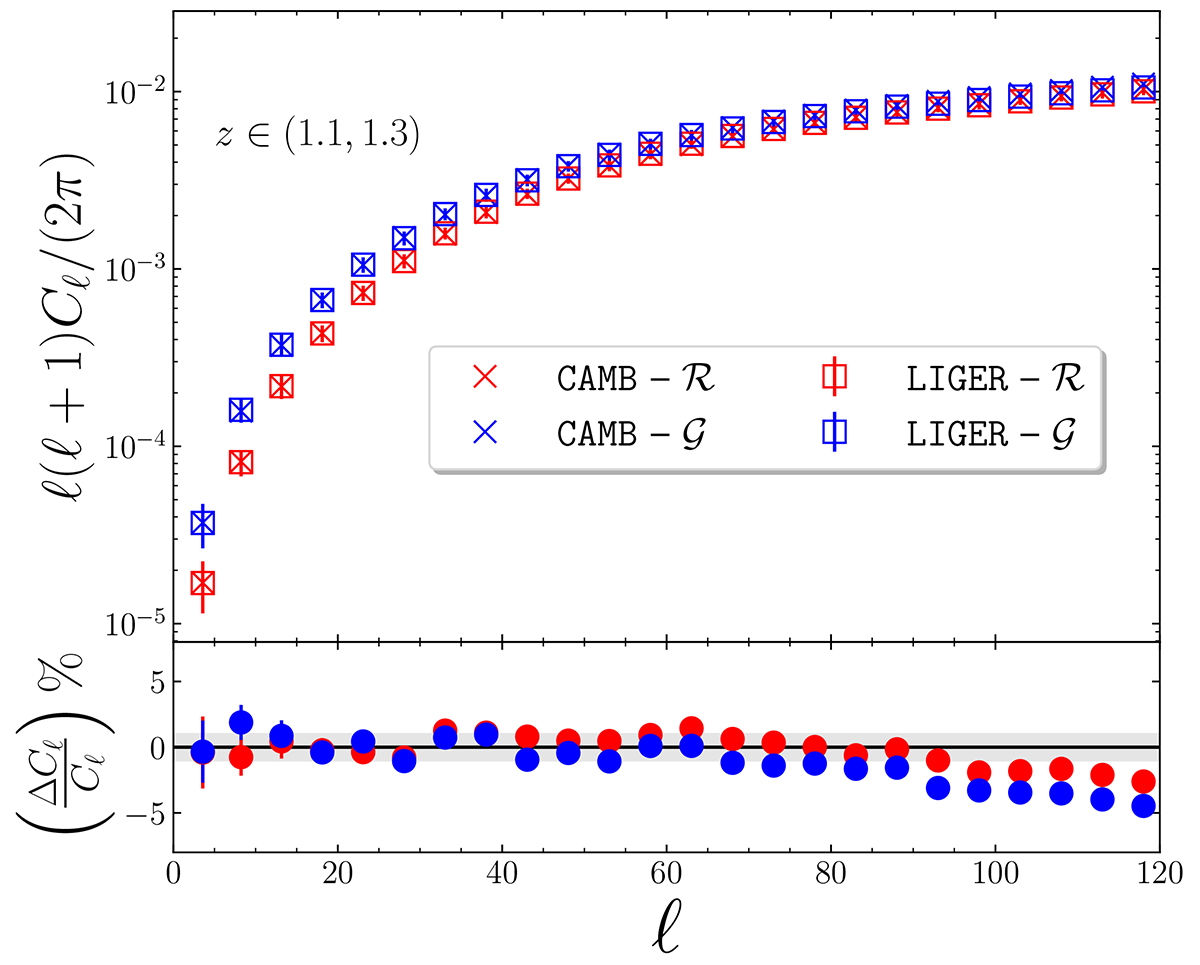
Fig. A.1.
Download original image
Top: Mean angular power spectra estimated from our mock catalogues (squares with RMS error bars) for the ℛ (red) and 𝒢 (blue) suites are compared to the corresponding output from the CAMB code (crosses). All spectra were binned using intervals Δℓ = 5. Bottom: Relative difference between the spectra (error bars here indicate the standard error of the mean).
Current usage metrics show cumulative count of Article Views (full-text article views including HTML views, PDF and ePub downloads, according to the available data) and Abstracts Views on Vision4Press platform.
Data correspond to usage on the plateform after 2015. The current usage metrics is available 48-96 hours after online publication and is updated daily on week days.
Initial download of the metrics may take a while.