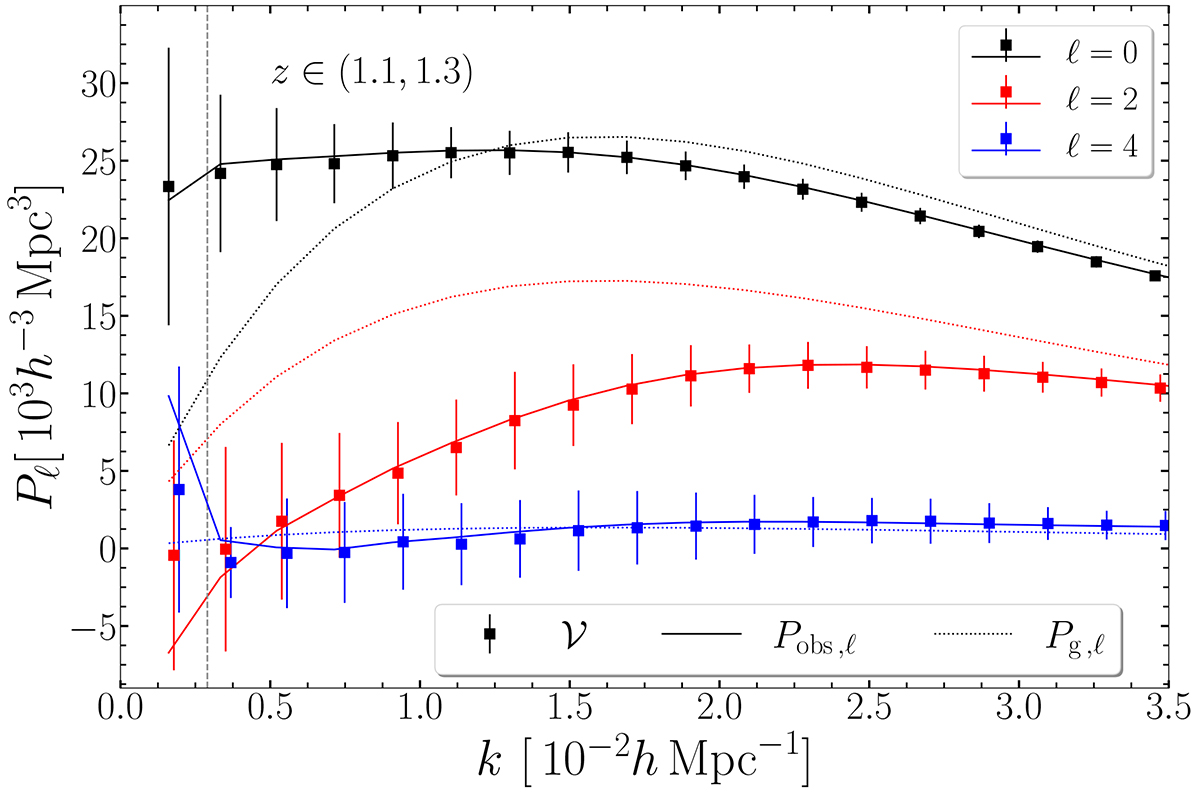
Fig. 13.
Download original image
Power-spectrum multipoles for the 𝒱 mocks in the redshift range z ∈ (1.1, 1.3). The mean and RMS scatter over the 140 mocks are displayed with squares and error bars, respectively. The solid and dotted lines show the theoretical predictions obtained with the Kaiser model (see Eq. (42)) with and without accounting for the window function of the EWSS (see Eq. (46)), respectively. The vertical dashed line marks the characteristic wavenumber, kC = 2 π/V1/3.
Current usage metrics show cumulative count of Article Views (full-text article views including HTML views, PDF and ePub downloads, according to the available data) and Abstracts Views on Vision4Press platform.
Data correspond to usage on the plateform after 2015. The current usage metrics is available 48-96 hours after online publication and is updated daily on week days.
Initial download of the metrics may take a while.