Fig. 5.
Download original image
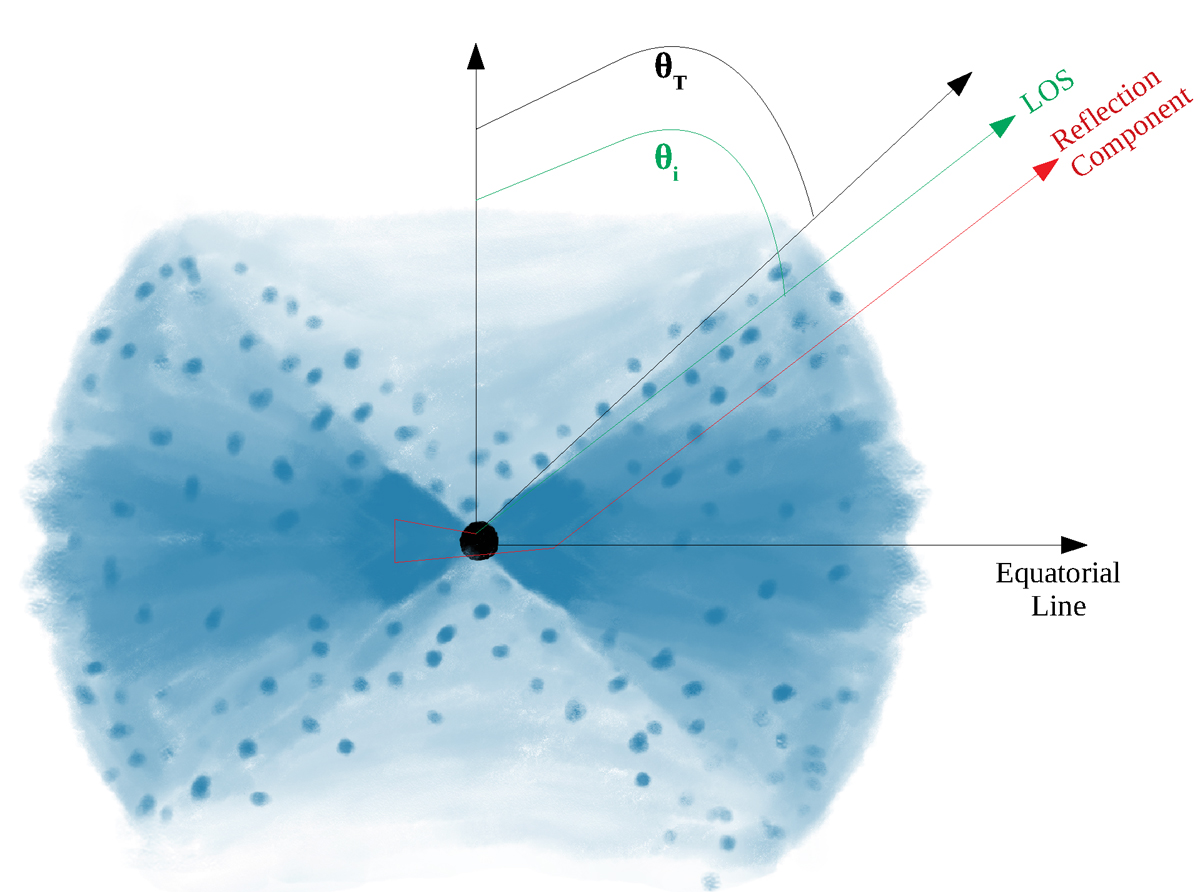
Schematic representation of the torus in NGC 6300, using the best-fit parameters from the physically motivated X-ray torus models. The darker color indicates a higher density of clouds, while the lighter shades represent areas with lower cloud density. The high density Compton-Thick clouds along the equatorial region is responsible for the reflection component. The inclination angle and torus opening angle are also shown.
Current usage metrics show cumulative count of Article Views (full-text article views including HTML views, PDF and ePub downloads, according to the available data) and Abstracts Views on Vision4Press platform.
Data correspond to usage on the plateform after 2015. The current usage metrics is available 48-96 hours after online publication and is updated daily on week days.
Initial download of the metrics may take a while.