Fig. 4.
Download original image
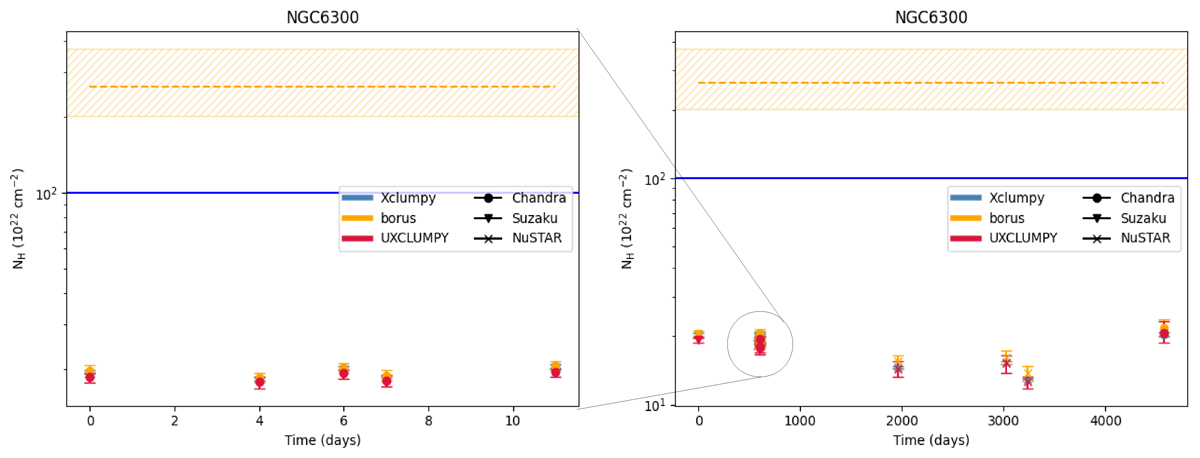
NH, LOS variability in all the ten epochs from 2007 to 2020, using all the X-ray torus models. The blue horizontal line indicates the Compton-Thick column density threshold. The dashed horizontal yellow line represents the best fit value for the average NH obtained from borus02. The yellow shaded area corresponds to the uncertainties associated to the average column density value. Left: All the observations from Chandra from 2009 are shown. Right: All the observations, including the Chandra ones.
Current usage metrics show cumulative count of Article Views (full-text article views including HTML views, PDF and ePub downloads, according to the available data) and Abstracts Views on Vision4Press platform.
Data correspond to usage on the plateform after 2015. The current usage metrics is available 48-96 hours after online publication and is updated daily on week days.
Initial download of the metrics may take a while.