Fig. 3.
Download original image
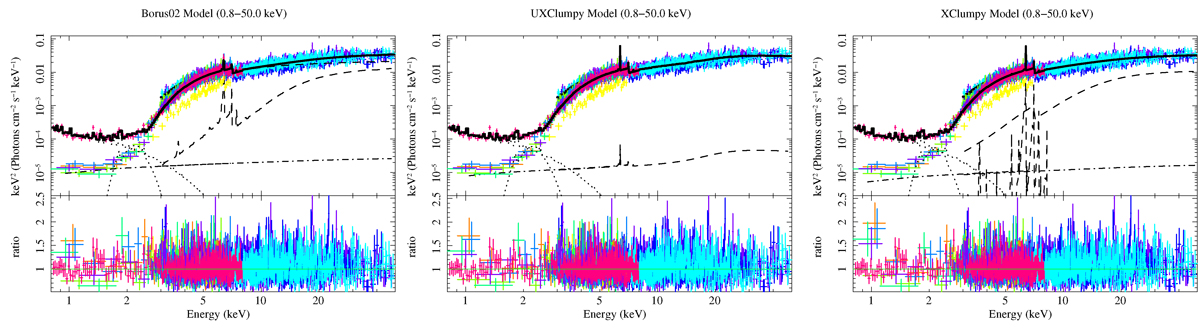
X-ray spectral fitting of borus02 (top), UXCLUMPY (middle) and XClumpy (bottom) models over unfolded spectrum of NGC 6300. The Chandra data are plotted in royal blue, orange, violet, lime, spring green and yellow. The NuSTAR data are plotted in magenta, blue, cyan. The Suzaku data are plotted in crimson. The best-fit model prediction is plotted as a black solid line. The single components of the model are plotted in black with different line styles. Here, we present the joint spectral fits for all epochs, covering the broad energy range of 0.8–50 keV. The individual spectral fits for each epoch are provided in Figures A.1 and A.2 in Appendix A. Left: For borus02, the absorbed intrinsic powerlaw and Compton reflection + line component is plotted with dashed line. The scattered component is marked as dot-dash line and the thermal emission from the multiphase medium as dotted line. Middle: In UXCLUMPY, the Compton reflection + line component is marked as dash line and scattered continuum as dot-dash line. Right: The Compton reflection and fluorescent line component is plotted as dash lines. The scattered continuum is plotted as dot-dash line. The thermal emission from the multiphase medium is marked as dotted line for all the three models.
Current usage metrics show cumulative count of Article Views (full-text article views including HTML views, PDF and ePub downloads, according to the available data) and Abstracts Views on Vision4Press platform.
Data correspond to usage on the plateform after 2015. The current usage metrics is available 48-96 hours after online publication and is updated daily on week days.
Initial download of the metrics may take a while.