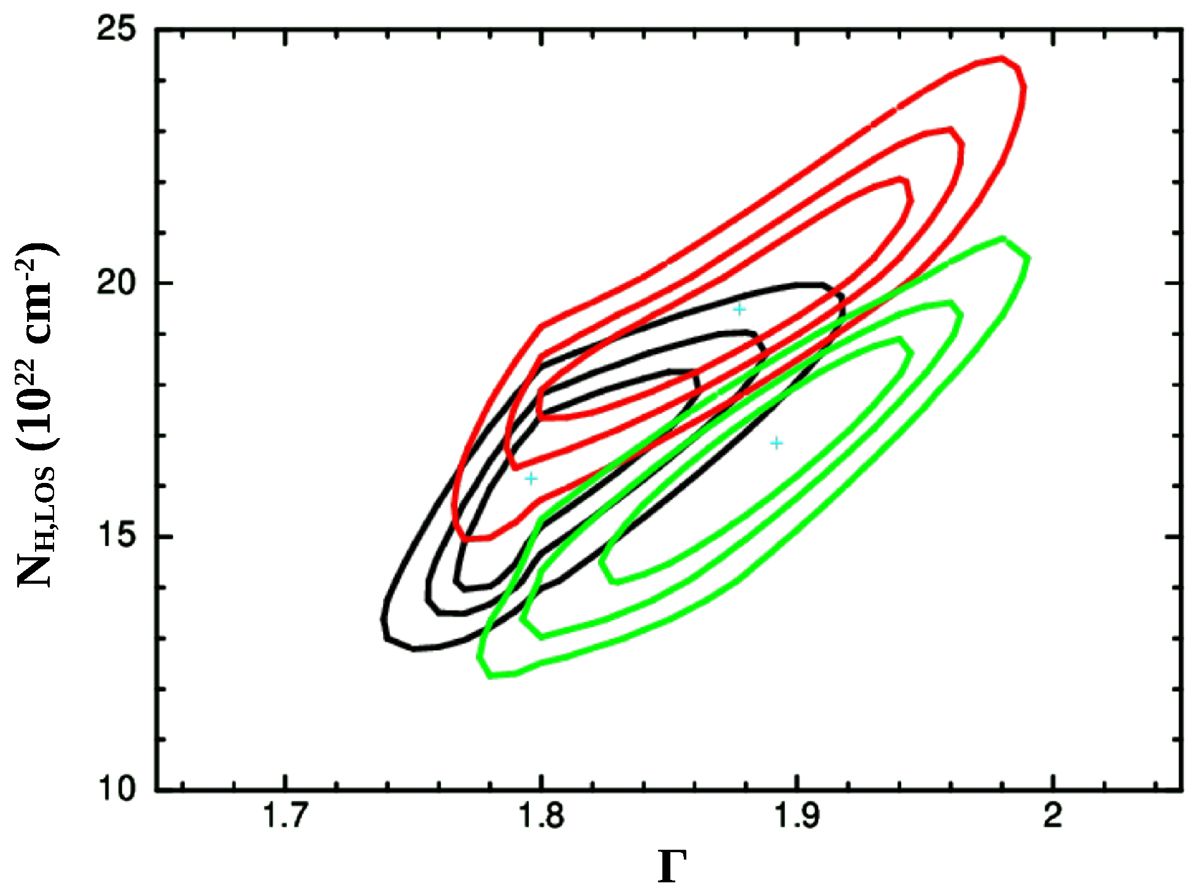
Fig. 2.
Download original image
Confidence contours are shown at the 68%, 90%, and 99% confidence levels, for LOS column density versus Γ parameters. The three colors represent the three NuSTAR observations: black for February 2013, red for January 2016, and green for August 2016. As all the models listed in Table B.1 are consistent with one another, only the fitting results from the UXCLUMPY model are shown here.
Current usage metrics show cumulative count of Article Views (full-text article views including HTML views, PDF and ePub downloads, according to the available data) and Abstracts Views on Vision4Press platform.
Data correspond to usage on the plateform after 2015. The current usage metrics is available 48-96 hours after online publication and is updated daily on week days.
Initial download of the metrics may take a while.