Fig. 8.
Download original image
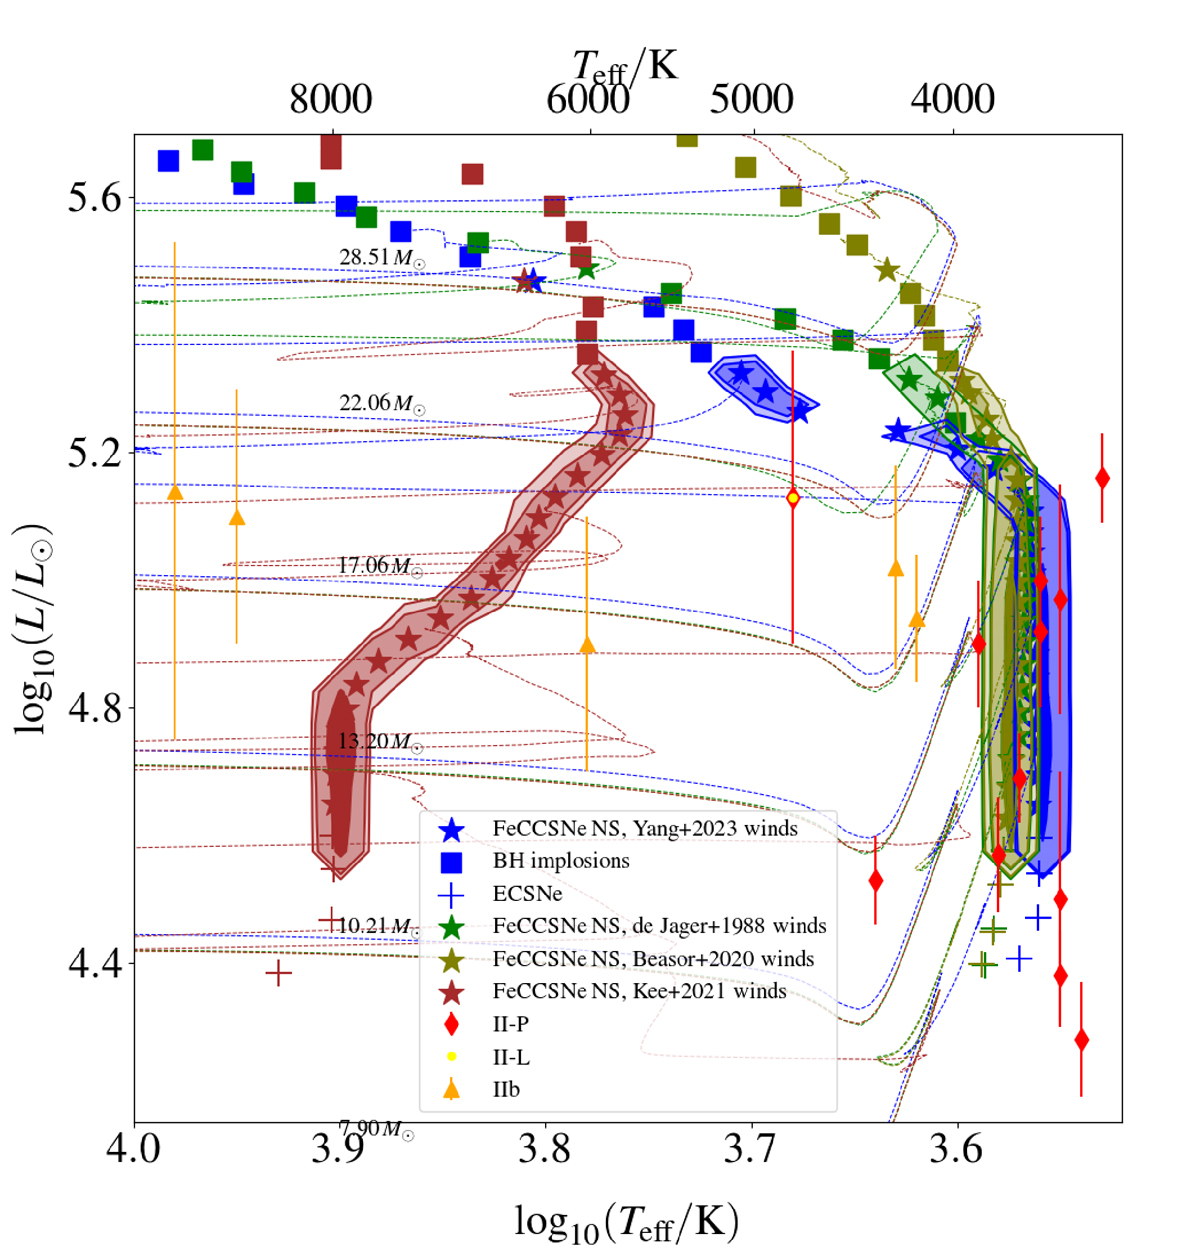
Hertzsprung-Russell diagram with the expected positions of the final state of the stars, before core-collapse. Successful FeCC explosions for each track (according to the SN prescription by Patton & Sukhbold 2020) are depicted with a star, implosions into a BH with probably no transient with a square, and ECSNe with plus signs. Contours represent the positions of the FeCC events only, with different colors representing the different RSG mass-loss prescriptions. We also show the position of the detected type II SN progenitors from the compilation of Farrell et al. (2020a).
Current usage metrics show cumulative count of Article Views (full-text article views including HTML views, PDF and ePub downloads, according to the available data) and Abstracts Views on Vision4Press platform.
Data correspond to usage on the plateform after 2015. The current usage metrics is available 48-96 hours after online publication and is updated daily on week days.
Initial download of the metrics may take a while.