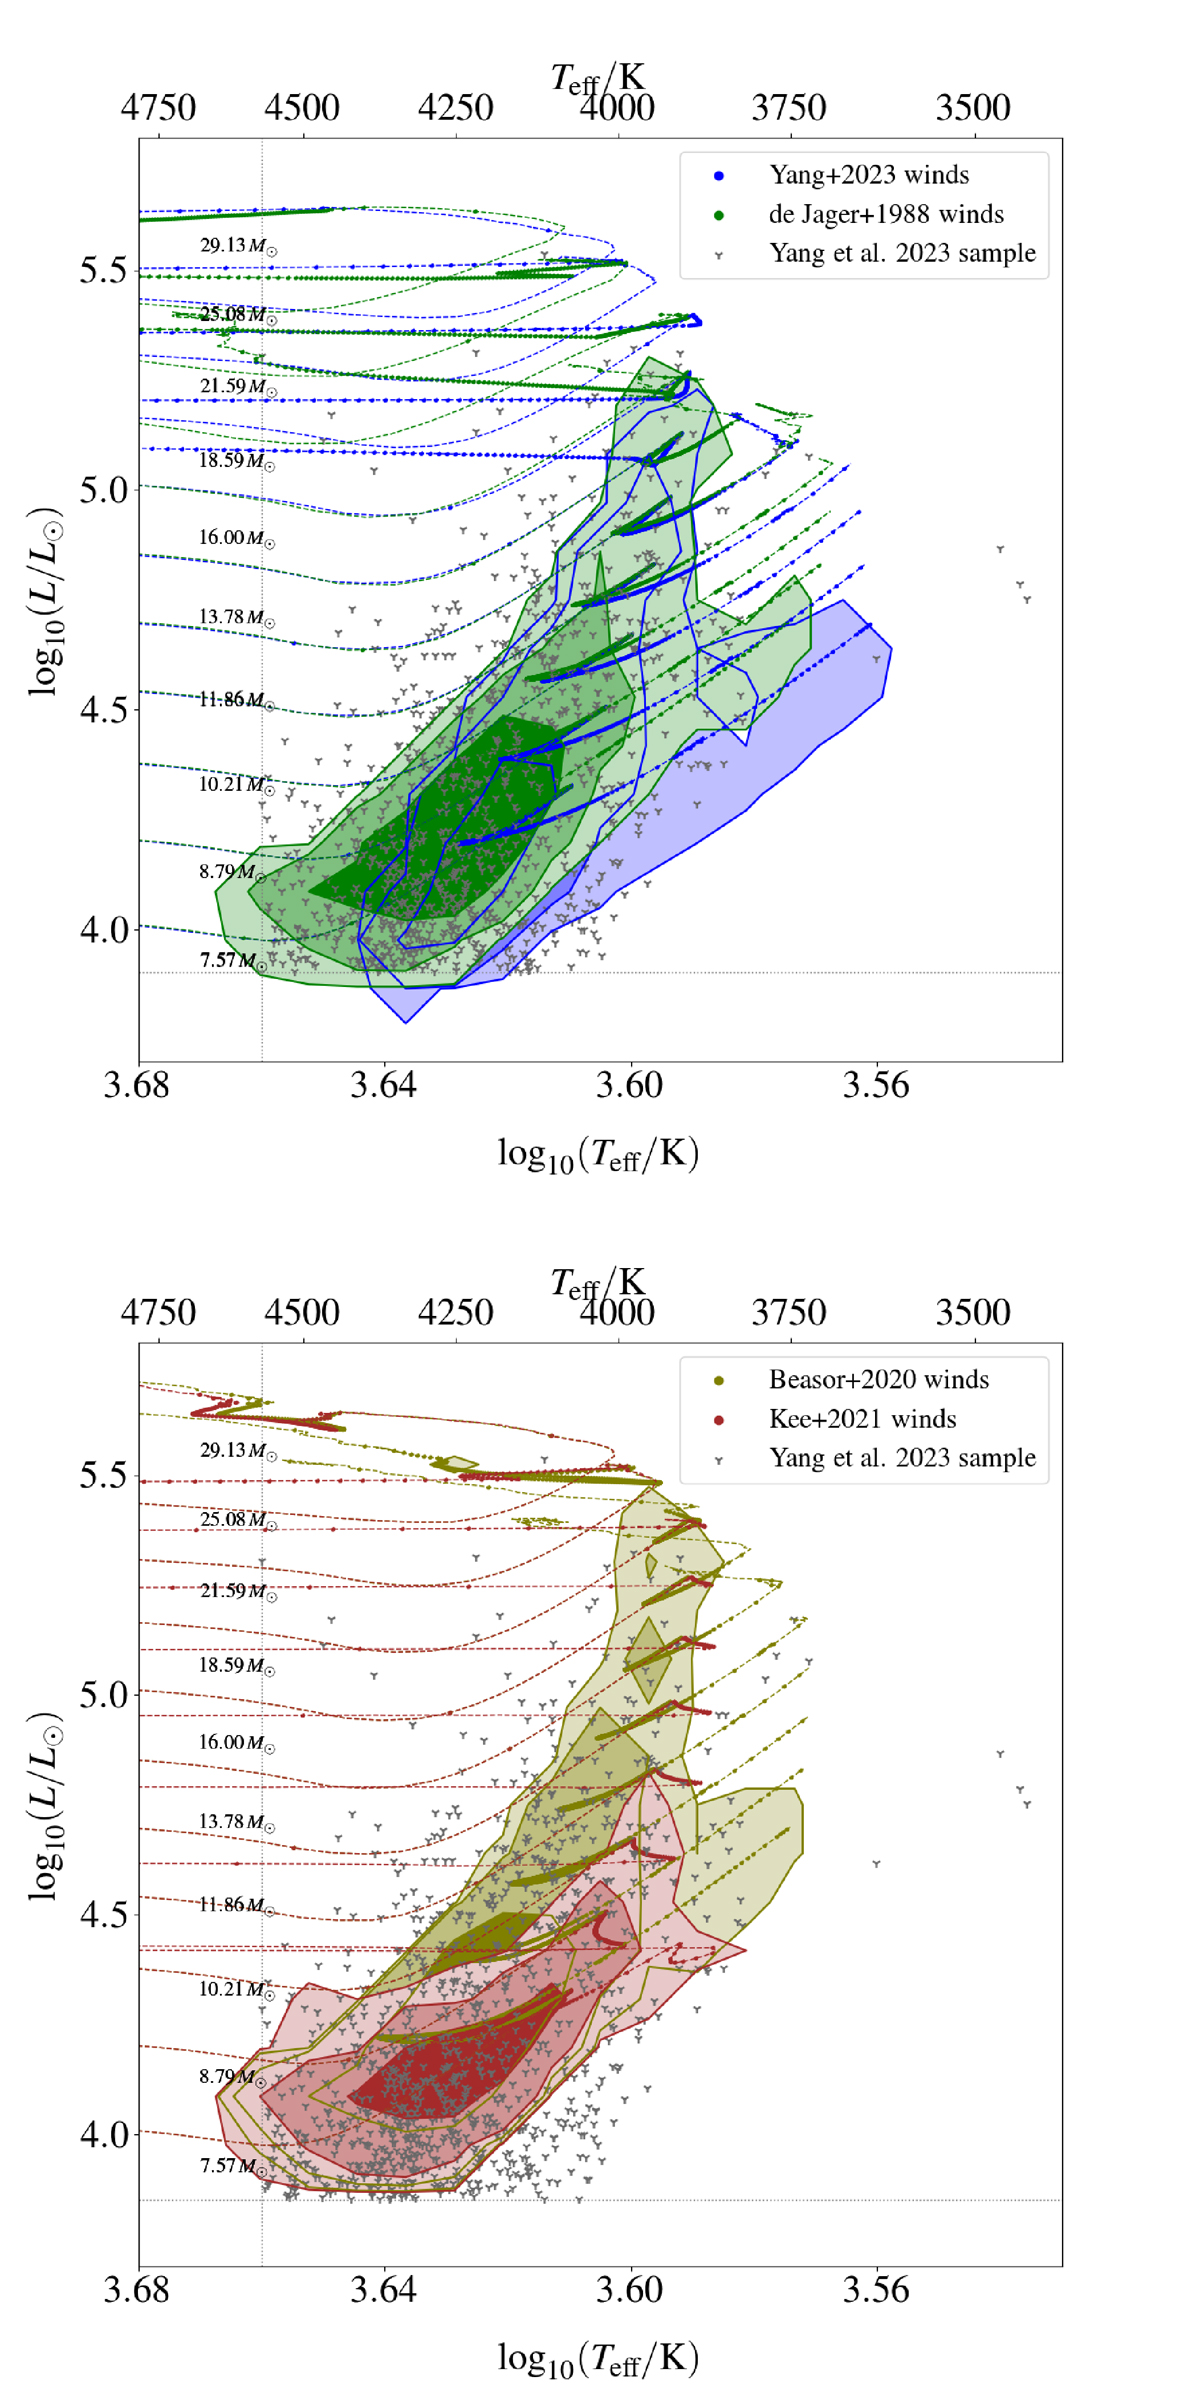
Fig. 5.
Download original image
Hertzsprung-Russell diagram of the RSGs in the SMC. The contours show the probability density of the position of RSGs that lose mass according to ṀY23 and ṀJ88 (top panel) or ṀB20 and ṀK21 (bottom), with contour levels denoting the 68%, 95%, and 99% confidence regions. Representative stellar tracks for various initial masses are also displayed, with points corresponding to evenly spaced timesteps of 2 × 10³ years. Grey points depict the observed RSGs from Yang et al. (2023) refined sample. We only show the results inside the conservative limits for a RSG of Lmin and Teff, max.
Current usage metrics show cumulative count of Article Views (full-text article views including HTML views, PDF and ePub downloads, according to the available data) and Abstracts Views on Vision4Press platform.
Data correspond to usage on the plateform after 2015. The current usage metrics is available 48-96 hours after online publication and is updated daily on week days.
Initial download of the metrics may take a while.