Fig. 2.
Download original image
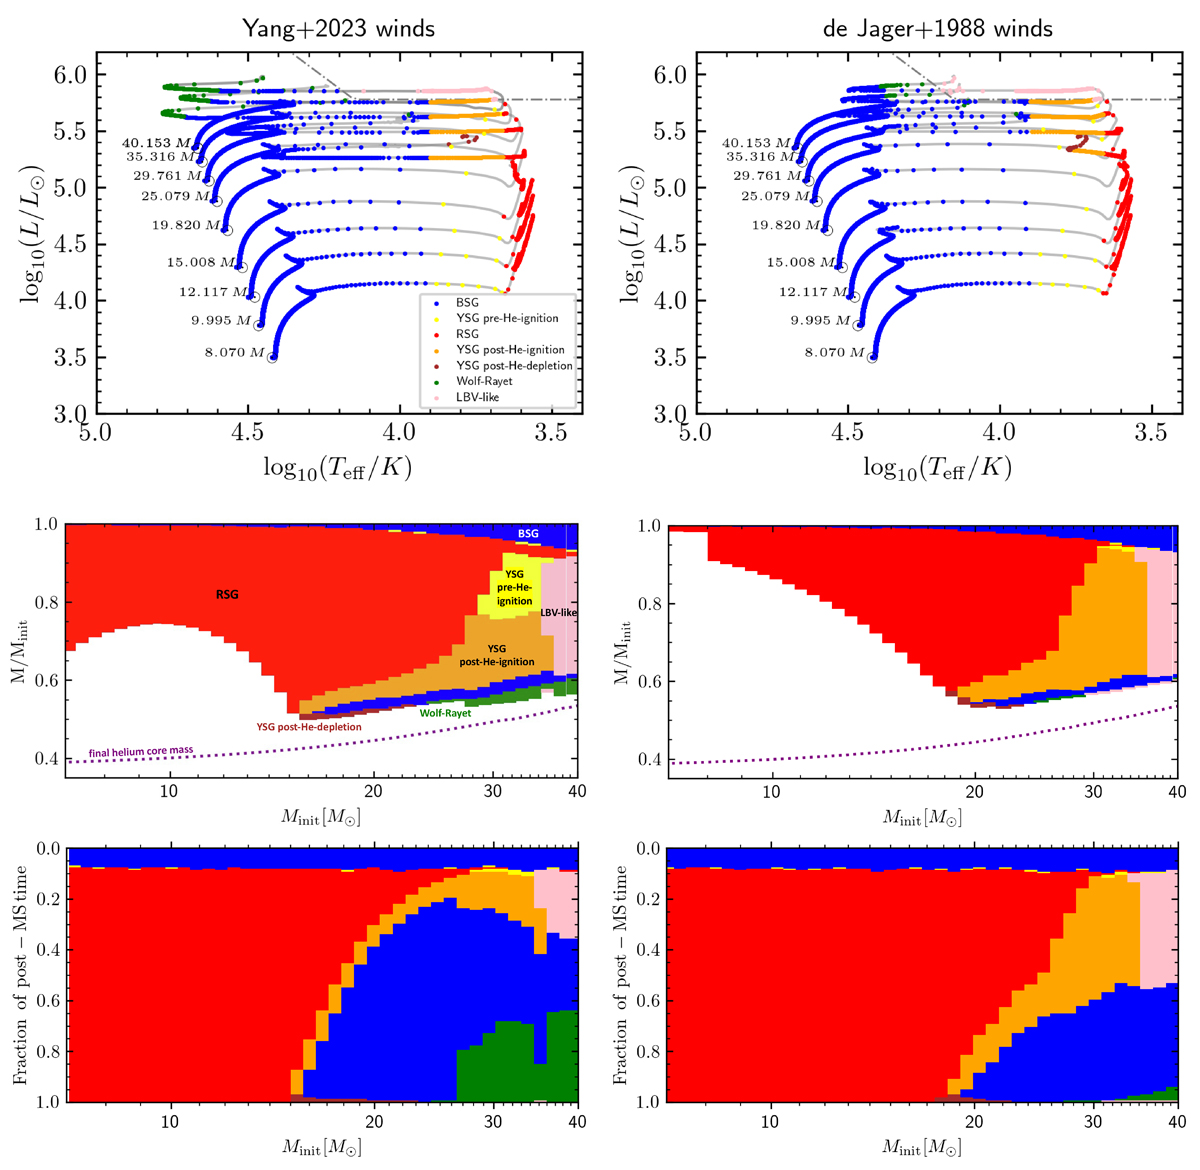
Evolution during different phases. Top: Indicative tracks of equal timesteps of 1kyr in the HRD with ṀY23 (left) and ṀJ88 (right), depicting the definition of each evolutionary phase. The initial mass is mentioned at the beginning of each track. The HD limit, where LBV-type winds kick in is also shown (grey dot-dashed line). Middle: Part of the stellar mass lost in each evolutionary phase, as a function of initial mass (evolution goes from top to bottom). We also show the value of the final helium core mass as a function of the initial (purple dotted line). Bottom: Fractional time spent in each evolutionary phase after the end of MS, as a function of initial mass (evolution goes from top to bottom).
Current usage metrics show cumulative count of Article Views (full-text article views including HTML views, PDF and ePub downloads, according to the available data) and Abstracts Views on Vision4Press platform.
Data correspond to usage on the plateform after 2015. The current usage metrics is available 48-96 hours after online publication and is updated daily on week days.
Initial download of the metrics may take a while.