Fig. A.1.
Download original image
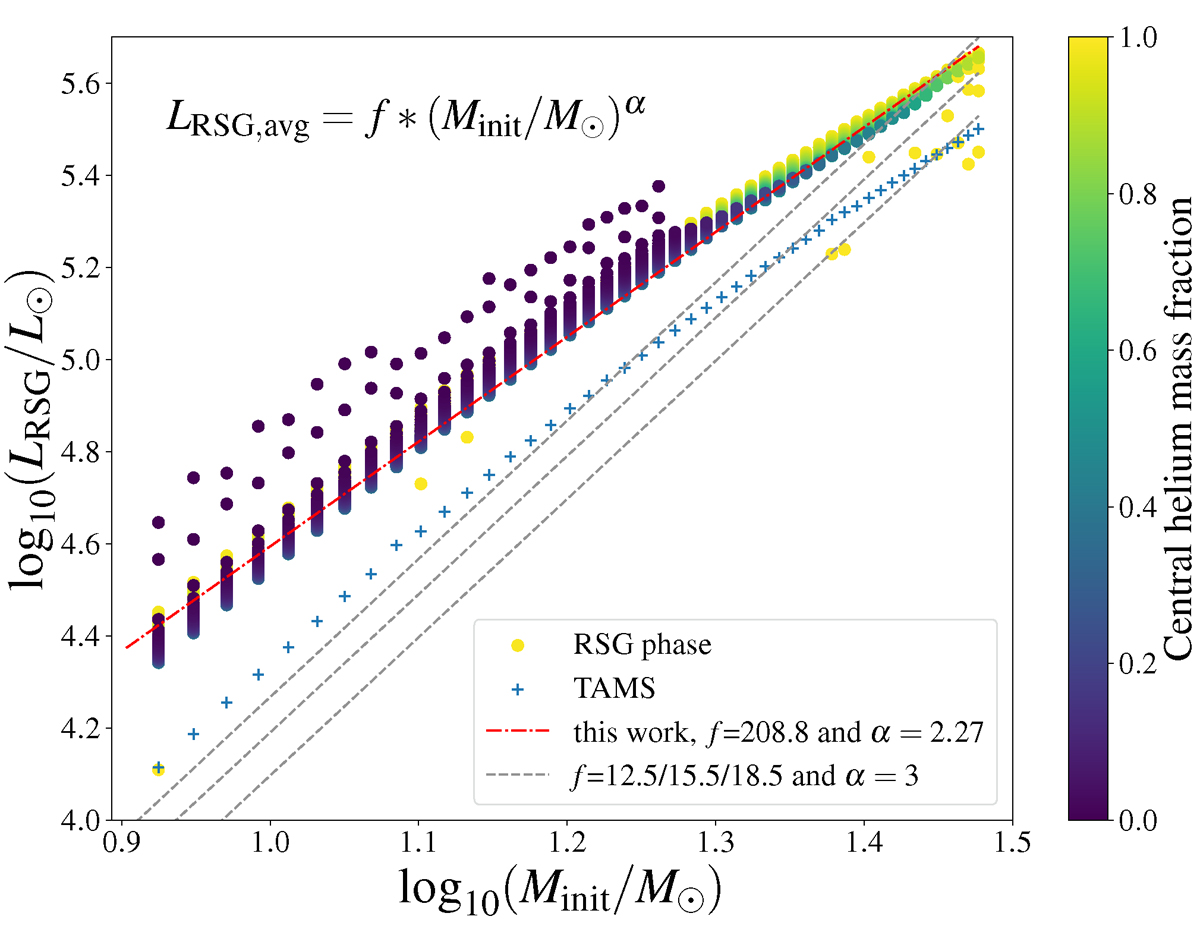
Luminosity during the RSG phase as a function of the initial mass of the star. The points are distributed in 100 equal timesteps that span the whole time range of each model during its RSG phase, colored by the central helium mass fraction. For reference, we also show the luminosity at TAMS and various fittings from this or previous works, of the form of Eq. A.1.
Current usage metrics show cumulative count of Article Views (full-text article views including HTML views, PDF and ePub downloads, according to the available data) and Abstracts Views on Vision4Press platform.
Data correspond to usage on the plateform after 2015. The current usage metrics is available 48-96 hours after online publication and is updated daily on week days.
Initial download of the metrics may take a while.