Fig. 4.
Download original image
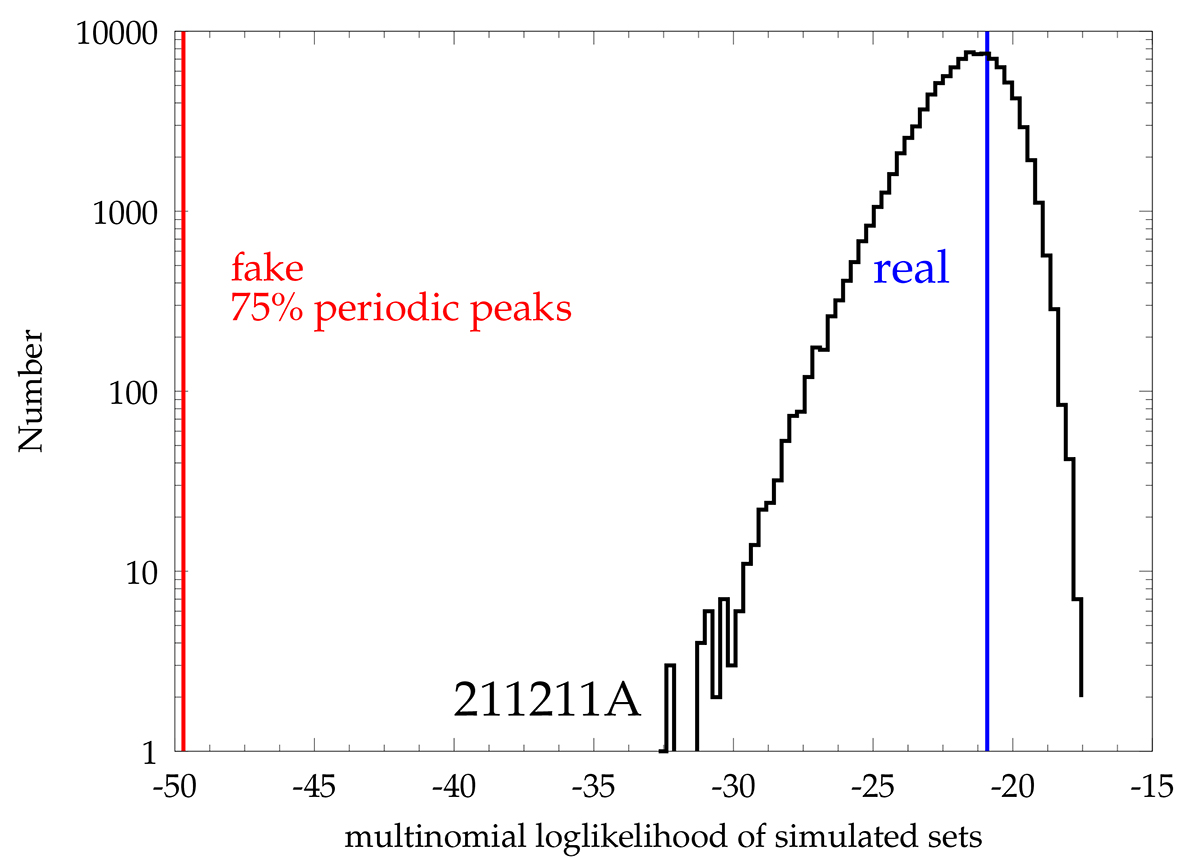
Distribution of the multinomial likelihood values calculated for each of the 105 simulated sets of peak times under the assumption of no periodic occurrences, in the case of GRB 211211A, also shown in Fig. 2. The vertical blue line shows the corresponding value for the real data, showing that the no-periodic occurences assumption cannot be rejected. Instead, the vertical red line shows the analogous result for a 211211A-like GRB sharing the same number of peaks and non-stationary profile, but with 75% periodic peaks. The p value is clearly ≪10−5.
Current usage metrics show cumulative count of Article Views (full-text article views including HTML views, PDF and ePub downloads, according to the available data) and Abstracts Views on Vision4Press platform.
Data correspond to usage on the plateform after 2015. The current usage metrics is available 48-96 hours after online publication and is updated daily on week days.
Initial download of the metrics may take a while.