Fig. A.1.
Download original image
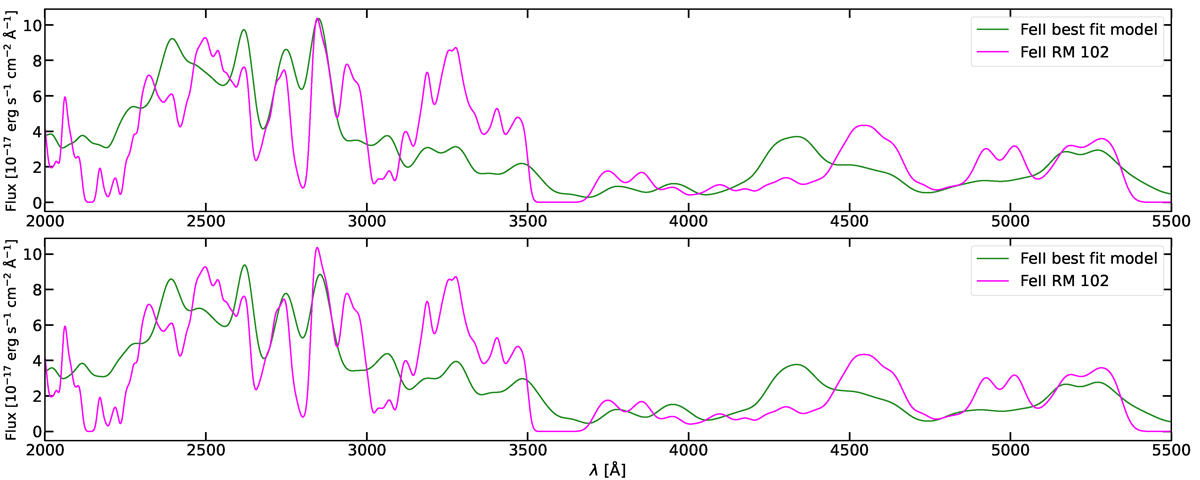
Comparison of the Fe II spectrum from our source with the best χ2 solutions employing the first three ratios (Section 3.3) in the computation. Top: Fe II spectrum assuming equal contribution from bright and dark sides, displayed with a 24% covering factor. The Fe II template corresponds to the CLOUDY simulation with logΦ(H) = 19.25 cm−2 s−1, log(Ptot) = 14 cm−3 K, Z = 20Z⊙ and Vturb = 40 km s−1. Bottom: Fe II spectrum assuming a 20% contribution from bright sides and 80% contribution from dark sides, displayed with a 33% covering factor. The Fe II template corresponds to the CLOUDY simulation associated with logΦ(H) = 19.75 cm−2 s−1, log(Ptot) = 15.50 cm−3 K, Z = 20Z⊙ and Vturb = 100 km s−1.
Current usage metrics show cumulative count of Article Views (full-text article views including HTML views, PDF and ePub downloads, according to the available data) and Abstracts Views on Vision4Press platform.
Data correspond to usage on the plateform after 2015. The current usage metrics is available 48-96 hours after online publication and is updated daily on week days.
Initial download of the metrics may take a while.