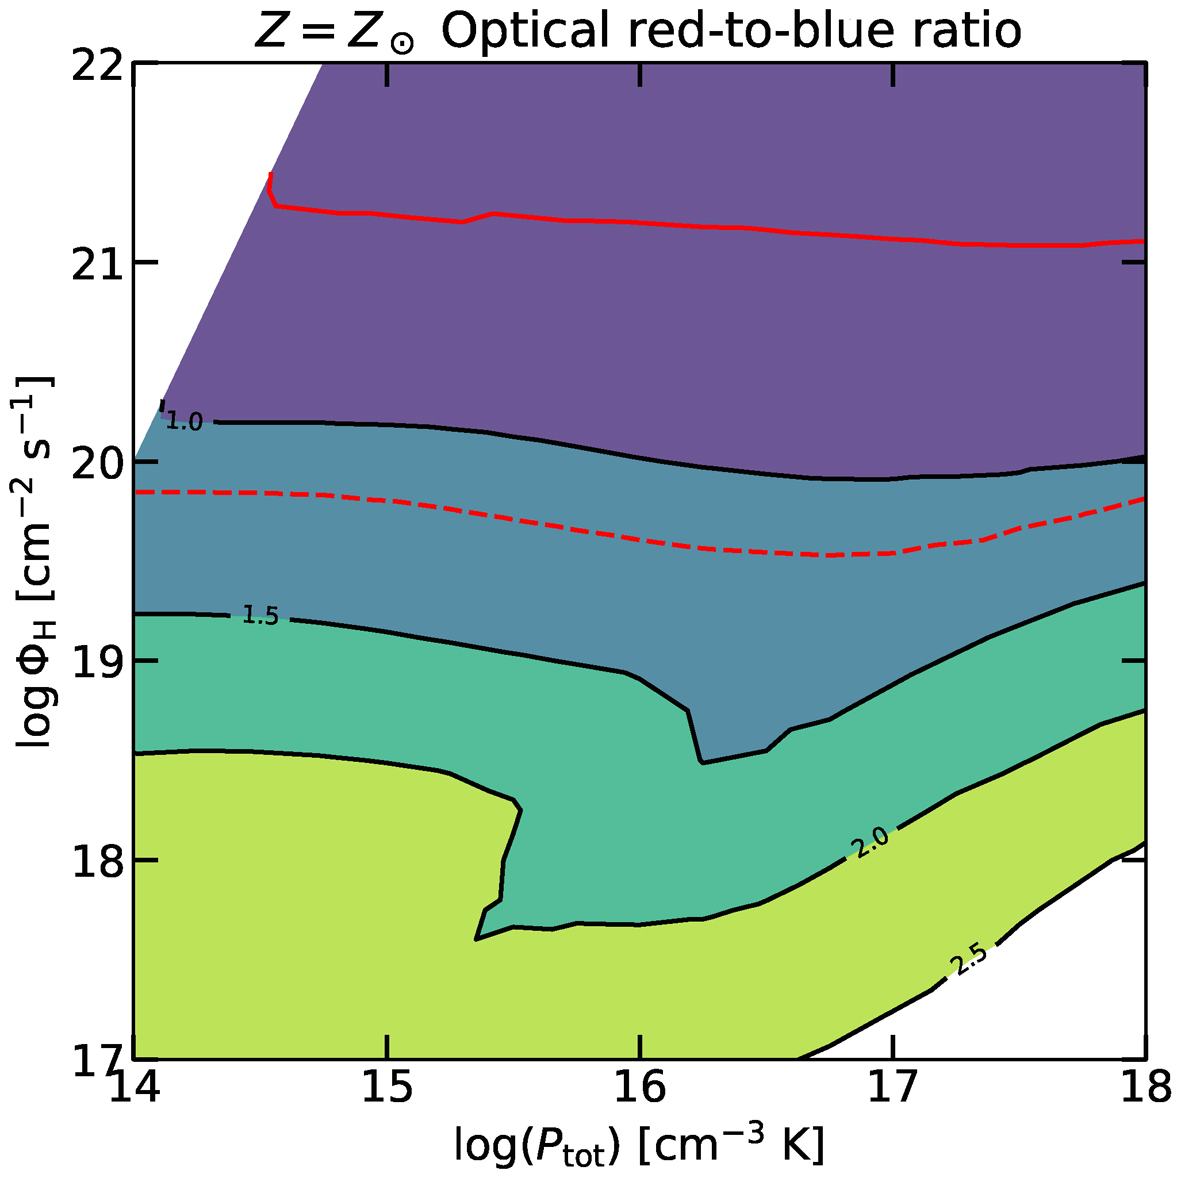
Fig. 3.
Download original image
Contour plots for the Ropt ratio described in Sect. 3.3 with constant Vturb = 0 km s−1, Z=Z⊙, and equal contributions from the bright sides and the dark sides of clouds. The position in the parameter space corresponding to the ratio measured in RM 102 is marked by a solid red line, while the dashed red line represents the 1-σ confidence range of the ratio.
Current usage metrics show cumulative count of Article Views (full-text article views including HTML views, PDF and ePub downloads, according to the available data) and Abstracts Views on Vision4Press platform.
Data correspond to usage on the plateform after 2015. The current usage metrics is available 48-96 hours after online publication and is updated daily on week days.
Initial download of the metrics may take a while.