Fig. 7.
Download original image
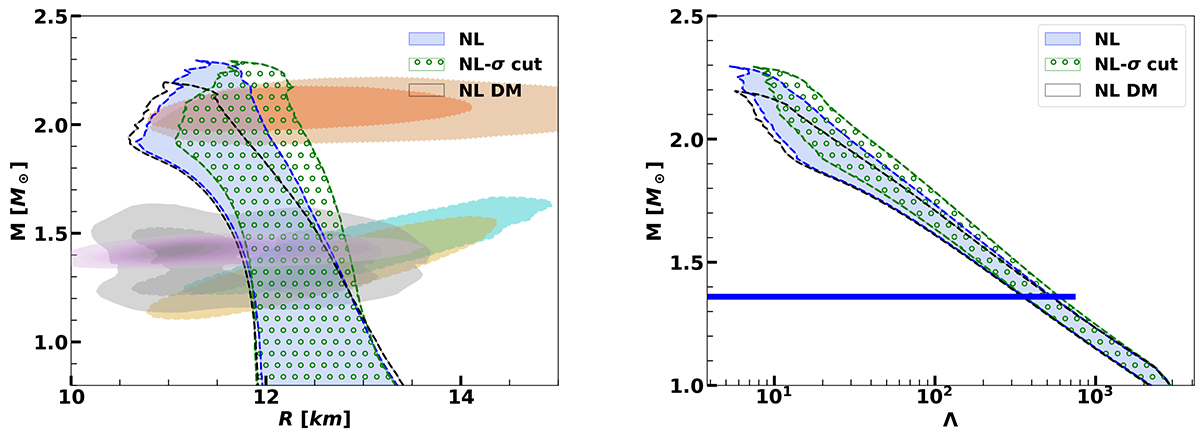
90% credible interval (CI) region for the neutron star (NS) mass-radius posterior P(R|M) is plotted for the NL, NL-σ cut, and NL-DM models. The gray area indicates the constraints obtained from the binary components of GW170817, with their respective 90% and 50% credible intervals. Additionally, the plot includes the 1σ (68%) CI for the 2D mass-radius posterior distributions of the millisecond pulsars PSR J0030 + 0451 (in cyan and yellow color) Riley et al. (2019), Miller et al. (2019) and PSR J0740 + 6620 (in orange and peru color) Riley et al. (2021), Miller et al. (2021), based on NICER X-ray observations. Furthermore, we display the latest NICER measurements for the mass and radius of PSR J0437-4715 Choudhury et al. (2024) (lilac color). Right: 90% CI region for the mass-tidal deformability posterior P(Λ|M) for the same models is presented. The blue bars represent the tidal deformability constraints at 1.36 M⊙ Abbott et al. (2018).
Current usage metrics show cumulative count of Article Views (full-text article views including HTML views, PDF and ePub downloads, according to the available data) and Abstracts Views on Vision4Press platform.
Data correspond to usage on the plateform after 2015. The current usage metrics is available 48-96 hours after online publication and is updated daily on week days.
Initial download of the metrics may take a while.