Fig. 8
Download original image
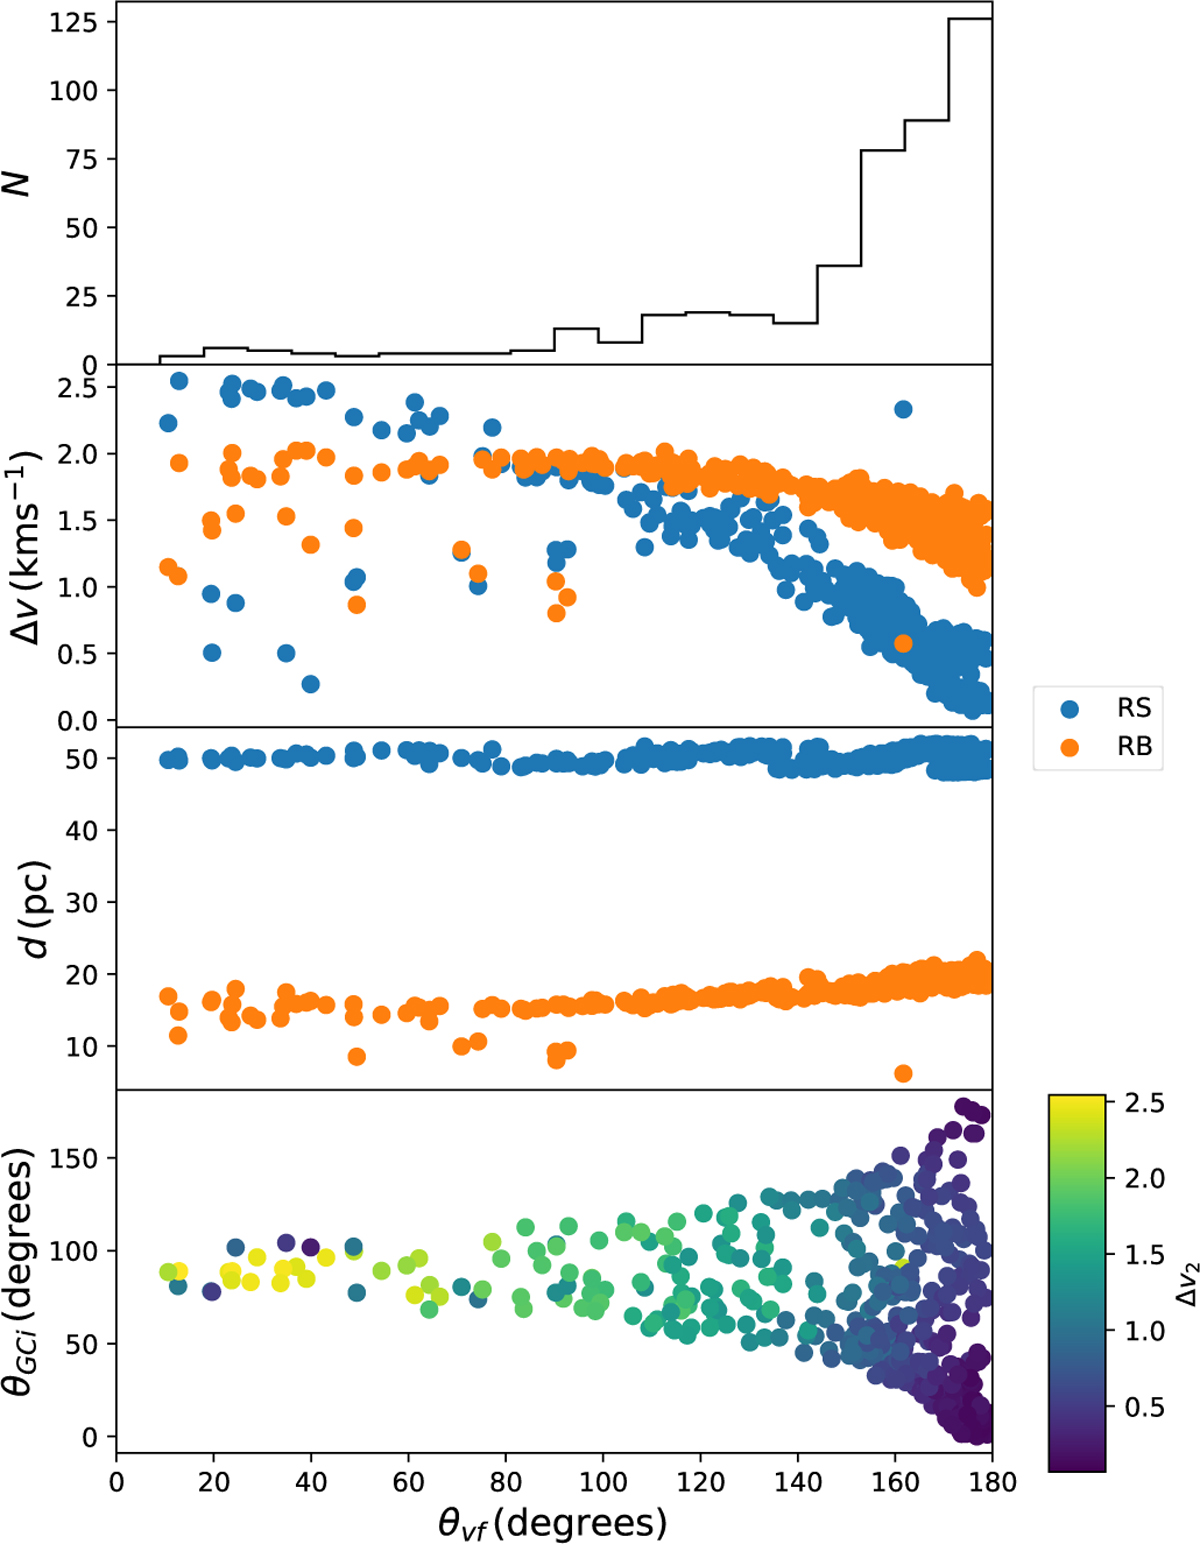
Results of integrating the trajectories of escapers from M67 in the Galactic potential until the least massive object reaches 50 pc from the cluster center. Each inset is plotted with respect to the final angle between the 3D velocity vectors of the escapers, θvf. (The initial angle between the velocity vectors is 180∘.) The top panel shows a histogram of the distribution of θvf for all pairs. The second panel shows the total change in velocity magnitude for each object in each pair. The third panel shows the final distances from the cluster center. In the bottom panel, the y-axis shows the initial direction of ejection of the lighter star, where θGC = 0∘ corresponds to ejection directly toward the Galactic center, and θGC = 90∘ corresponds to ejection in the direction of motion of the cluster.
Current usage metrics show cumulative count of Article Views (full-text article views including HTML views, PDF and ePub downloads, according to the available data) and Abstracts Views on Vision4Press platform.
Data correspond to usage on the plateform after 2015. The current usage metrics is available 48-96 hours after online publication and is updated daily on week days.
Initial download of the metrics may take a while.