Fig. 7
Download original image
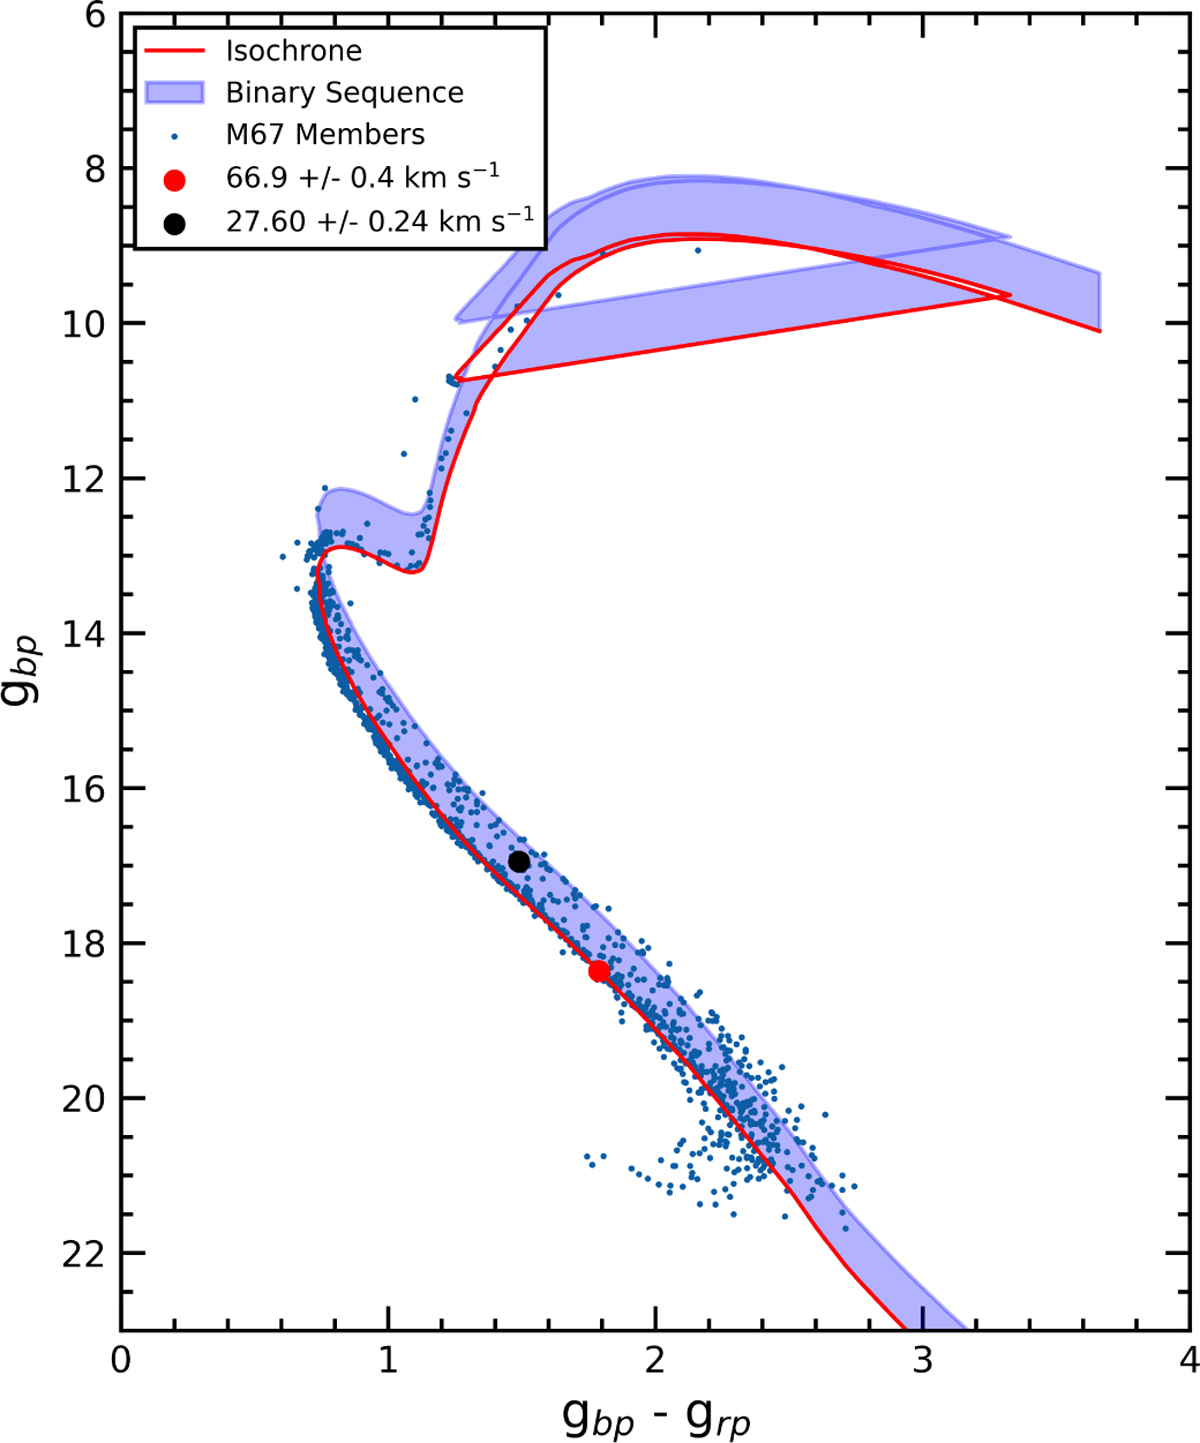
Color-magnitude diagram of the old OC M67 plotted using the Gaia data. Only stars indicated as high-probability cluster members in Childs et al. (2024) have been selected and are plotted as small blue dots. The solid red lines show the best-fitting isochrone (lower line) as well as the equal-mass binary sequence shifted 0.75 mag above it (upper line). The larger dots indicate the two components of our one candidate pair that passes all of our criteria. The red and black dots correspond to, respectively, the faster and slower moving objects. The cluster members do not include blue stragglers and other binary evolution products because they are far from a standard isochrone fit.
Current usage metrics show cumulative count of Article Views (full-text article views including HTML views, PDF and ePub downloads, according to the available data) and Abstracts Views on Vision4Press platform.
Data correspond to usage on the plateform after 2015. The current usage metrics is available 48-96 hours after online publication and is updated daily on week days.
Initial download of the metrics may take a while.