Fig. 6
Download original image
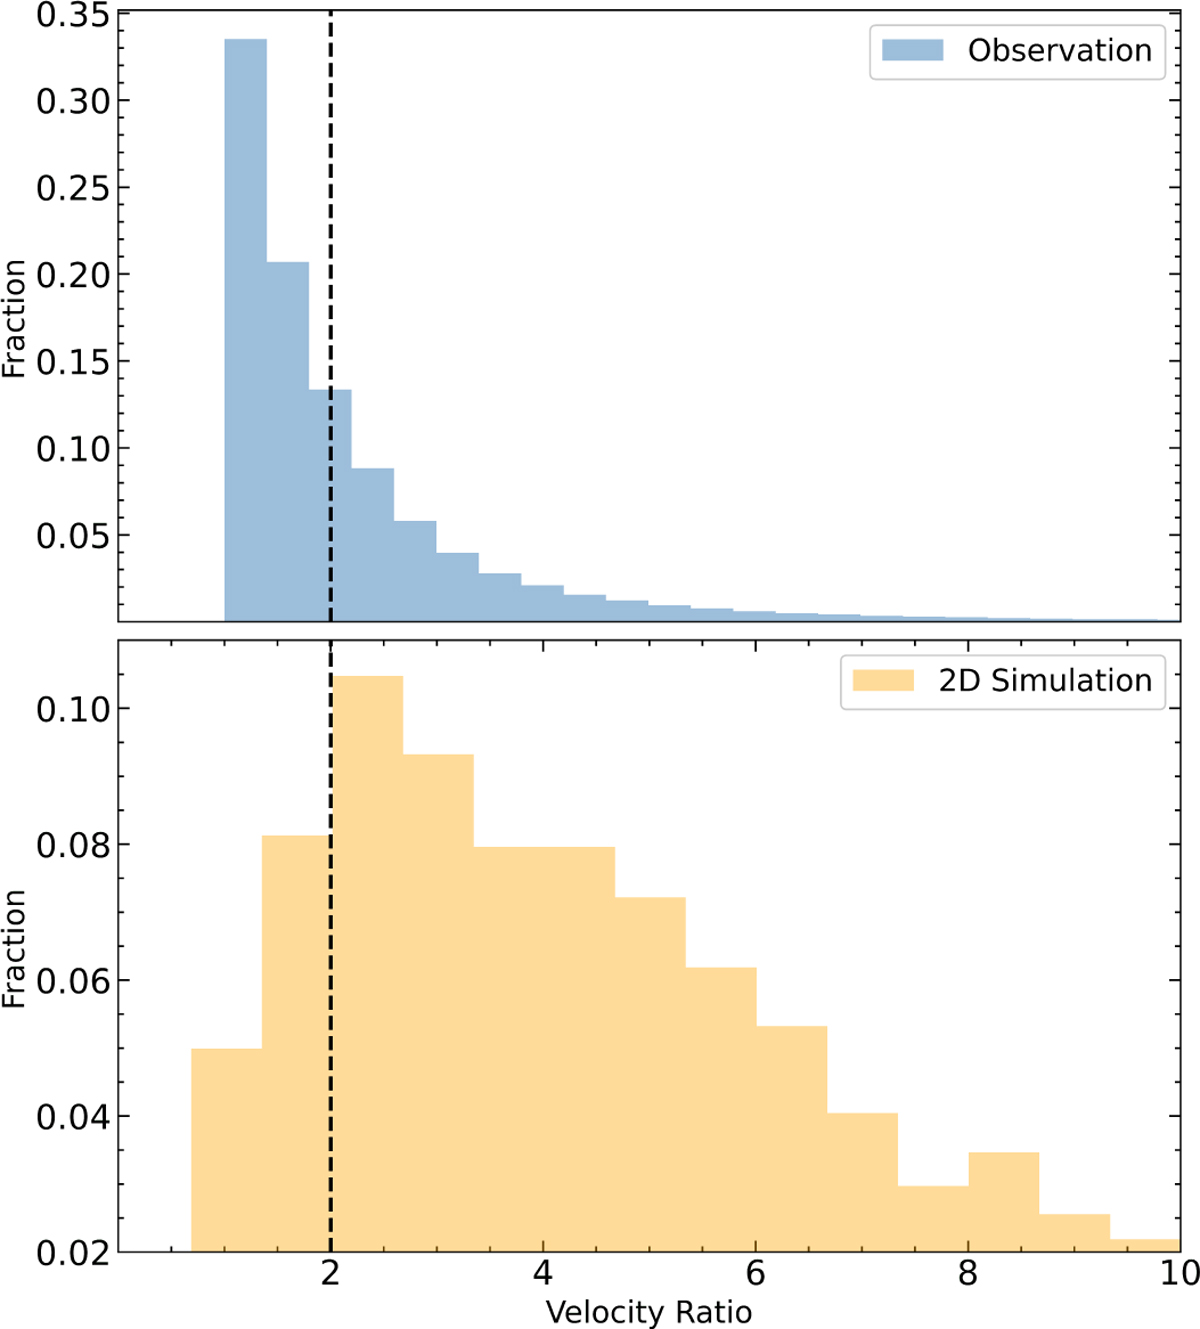
Histogram showing the distribution of velocity ratios. The top panel represents every pair from a simulation using Corespray, and the bottom panel shows all the pairs in our observational data. The vertical dashed line shows a critical ratio of two. Theory predicts that it is very likely that RS-RBs have velocity ratios greater than two, as can be seen in the simulated data set. On the other hand, the observational data show that more than half of the pairs have velocity ratios of less than two.
Current usage metrics show cumulative count of Article Views (full-text article views including HTML views, PDF and ePub downloads, according to the available data) and Abstracts Views on Vision4Press platform.
Data correspond to usage on the plateform after 2015. The current usage metrics is available 48-96 hours after online publication and is updated daily on week days.
Initial download of the metrics may take a while.