Fig. 5
Download original image
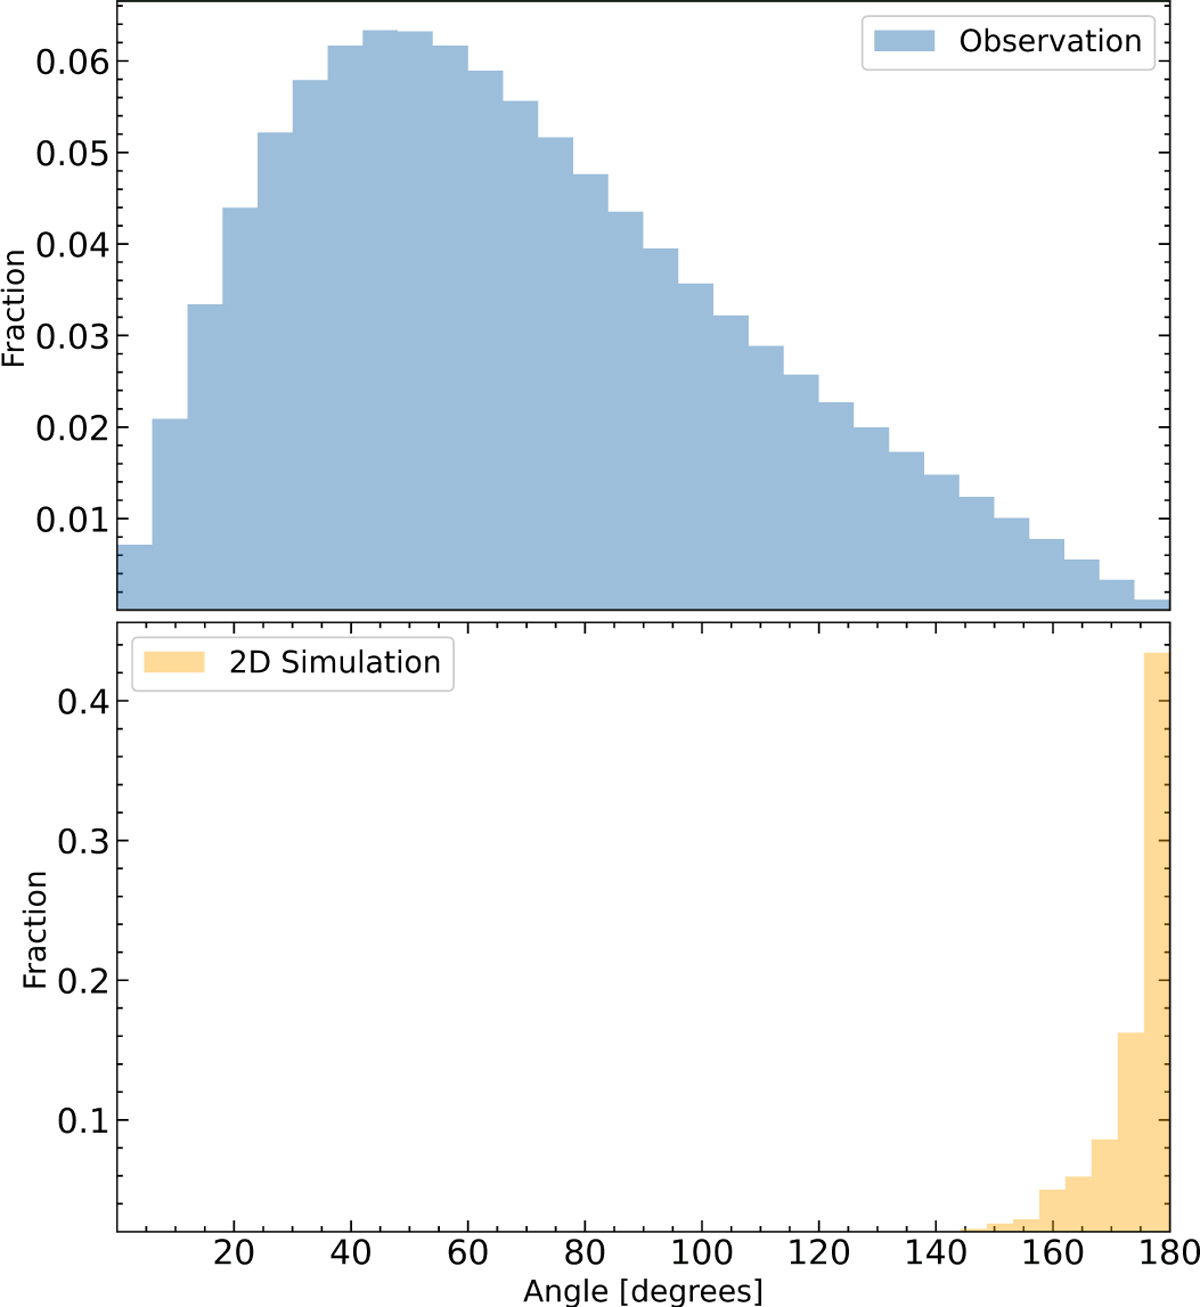
Histogram showing the distribution of intersection angles between the primary vector of every pair. The x-axis shows the angle in degrees. The top panel shows the projected angle for every pair from our Corespray simulations. The bottom panel shows the distribution with observational data. The simulation shows that most of the pairs tend to have angles near 180∘. In contrast, the pairs from the observational data set have a very low number of pairs near 180∘. This difference between the simulation (only pairs resulting from three-body disintegration) and observational (random sources in a field of view) distributions shows the angle to be one of the most important filters for the method.
Current usage metrics show cumulative count of Article Views (full-text article views including HTML views, PDF and ePub downloads, according to the available data) and Abstracts Views on Vision4Press platform.
Data correspond to usage on the plateform after 2015. The current usage metrics is available 48-96 hours after online publication and is updated daily on week days.
Initial download of the metrics may take a while.