Open Access
Fig. 9
Download original image
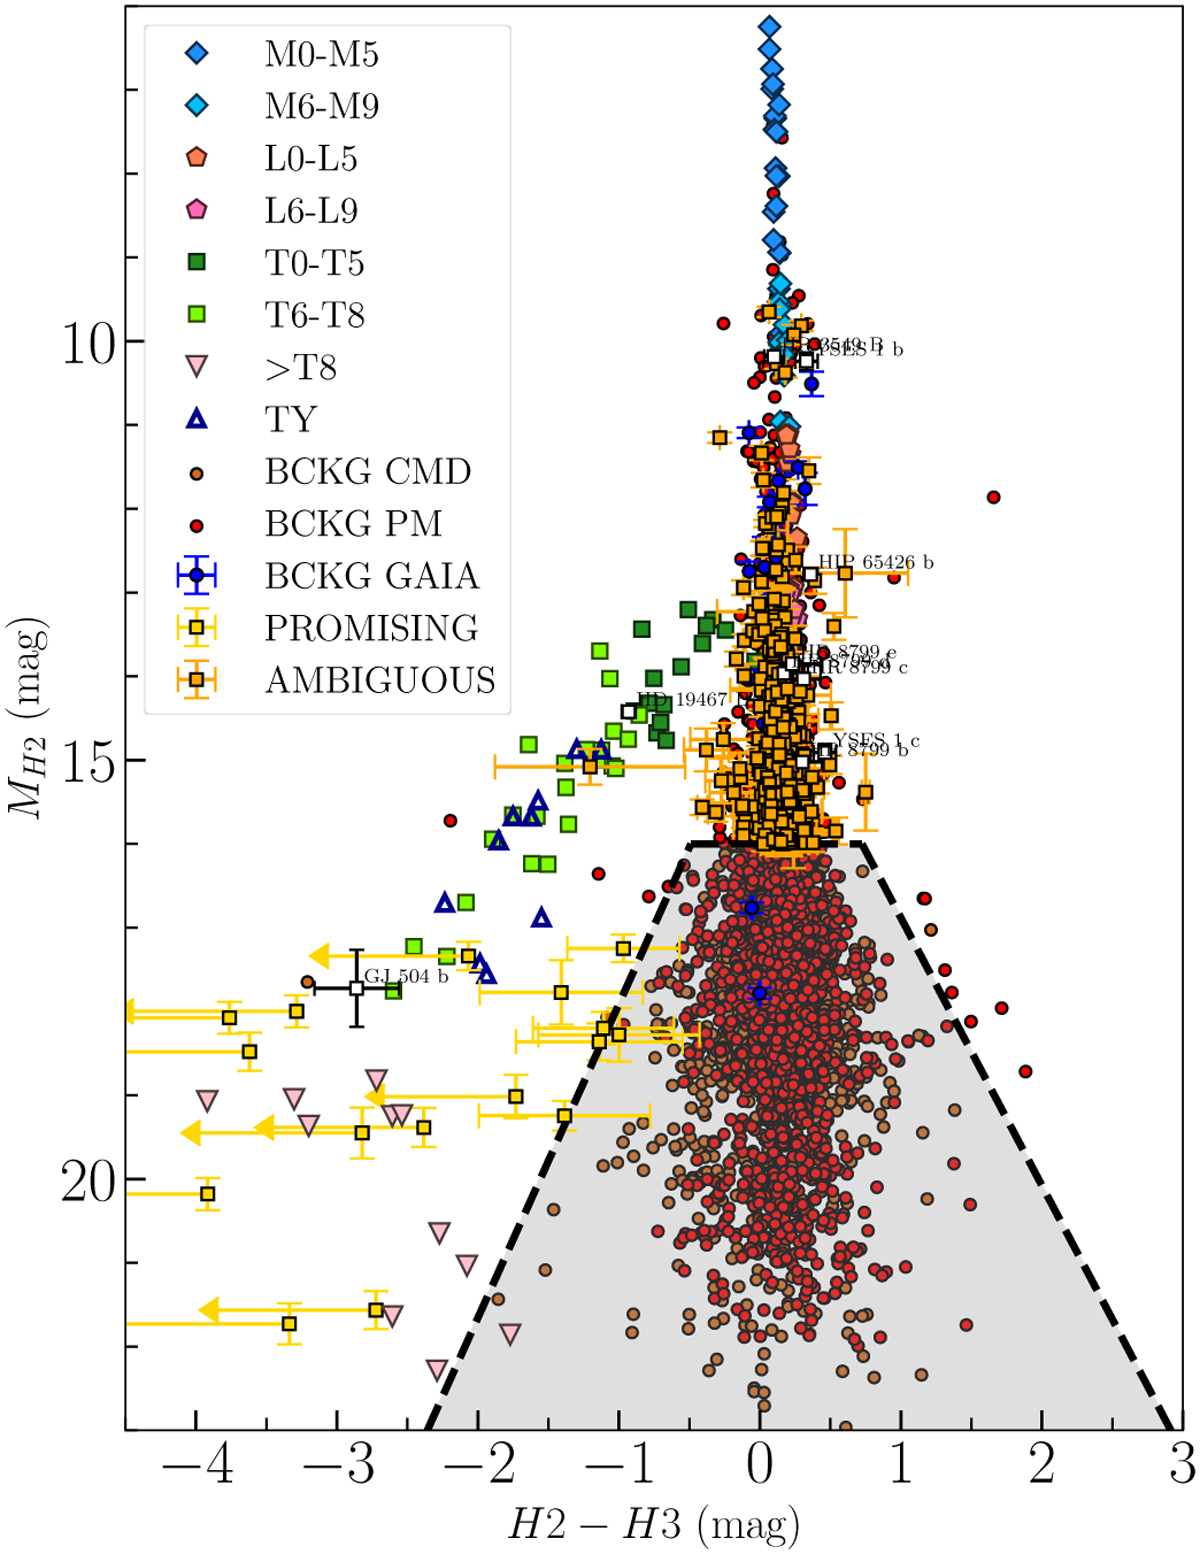
H2–H3 color-magnitude diagram with every non confirmed bound source detected during the SHINE survey. Error bars for background sources are removed for clarity purposes. The background exclusion area is indicated by the grey area and corresponds to a 5σ exclusion area.
Current usage metrics show cumulative count of Article Views (full-text article views including HTML views, PDF and ePub downloads, according to the available data) and Abstracts Views on Vision4Press platform.
Data correspond to usage on the plateform after 2015. The current usage metrics is available 48-96 hours after online publication and is updated daily on week days.
Initial download of the metrics may take a while.