Fig. 7
Download original image
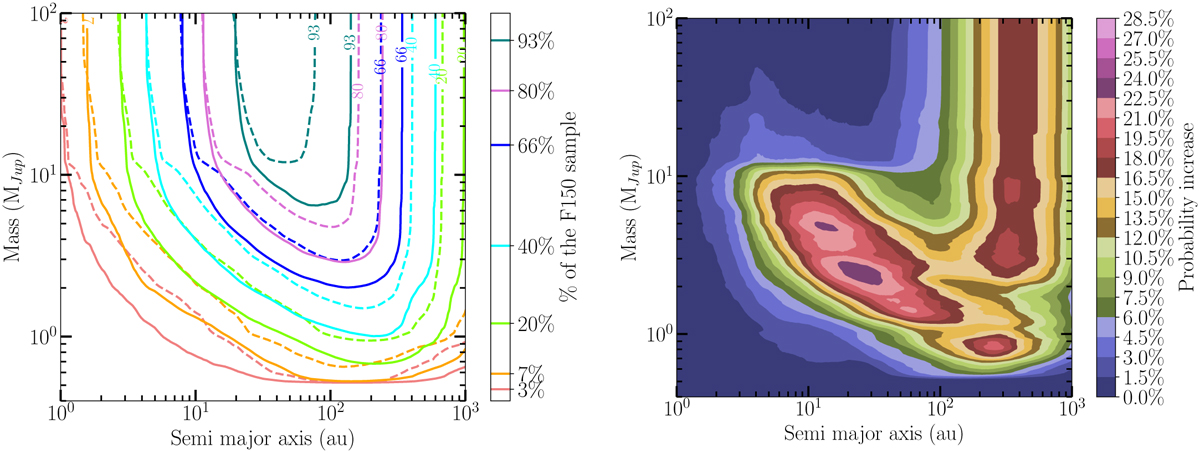
Detection performance comparison between this work and the detection limits computed in Vigan et al. (2021). Left: comparison between the sensitivity achieved by Vigan et al. (2021) using classical post-processing algorithms (Langlois et al. 2021) on the F150 (dashed lines) compared to the sensitivity achieved using PACO on the same sample of stars (plain lines). The lower limit seen around 100 au at 0.5 MJup is due to the COND model, which does not provide inputs for lower masses. Right: probability increase (![]() (sma, MJup) –
(sma, MJup) – ![]() (sma, MJup)) between the PACO analysis and the one presented in Vigan et al. (2021).
(sma, MJup)) between the PACO analysis and the one presented in Vigan et al. (2021).
Current usage metrics show cumulative count of Article Views (full-text article views including HTML views, PDF and ePub downloads, according to the available data) and Abstracts Views on Vision4Press platform.
Data correspond to usage on the plateform after 2015. The current usage metrics is available 48-96 hours after online publication and is updated daily on week days.
Initial download of the metrics may take a while.