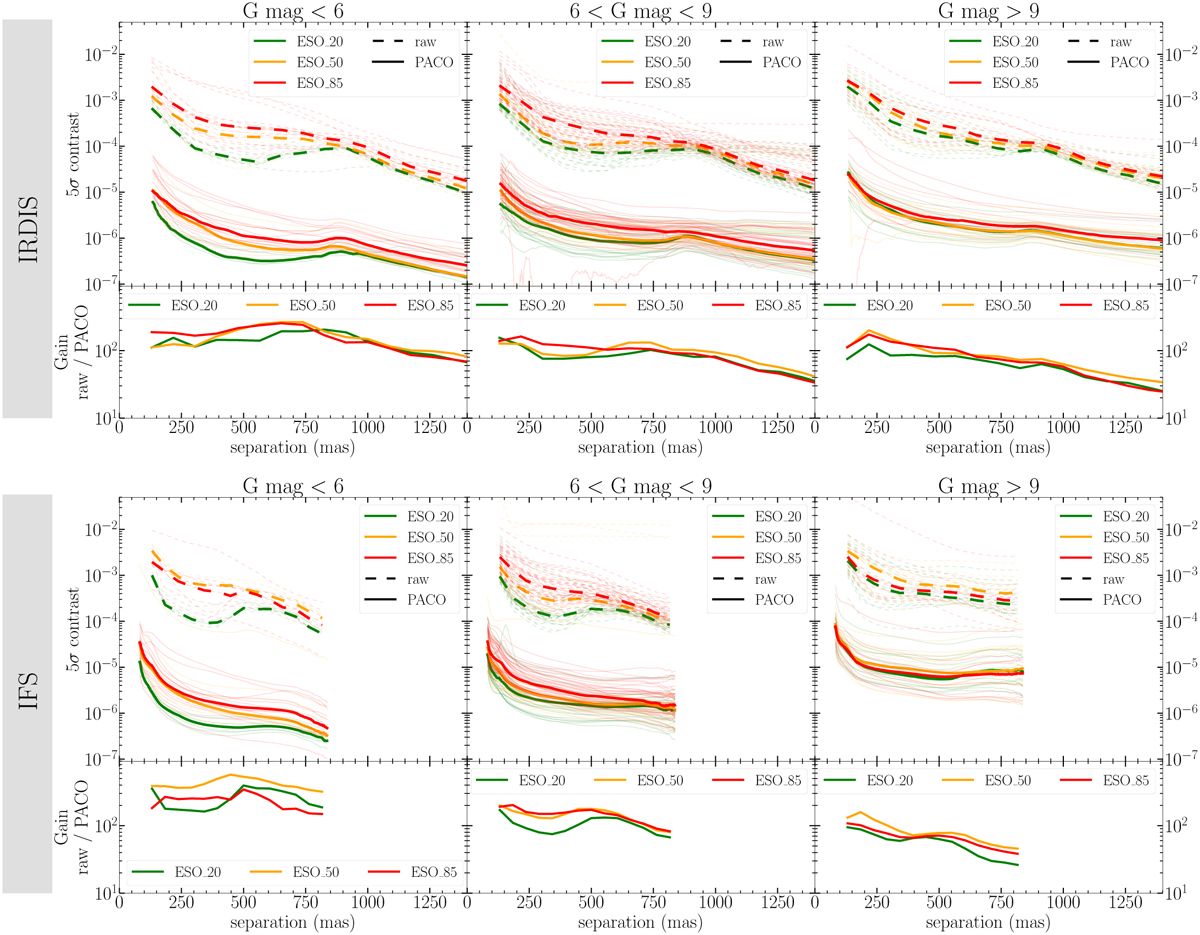
Fig. 5
Download original image
Contrast comparison between the raw contrast (median average spectrally and spatially, dashed lines) and the PACO contrast, both at 5σ. Three bins of star magnitudes and observing conditions are considered. Individual observations are represented by the thin lines and the median for each observing condition by the thick lines. The gain gives the contrast improvement between the median raw curves and the median PACO curves, provided for different observing conditions and different star brightness. The average size of the coronagraph’s inner working angle is around 100 mas.
Current usage metrics show cumulative count of Article Views (full-text article views including HTML views, PDF and ePub downloads, according to the available data) and Abstracts Views on Vision4Press platform.
Data correspond to usage on the plateform after 2015. The current usage metrics is available 48-96 hours after online publication and is updated daily on week days.
Initial download of the metrics may take a while.