Fig. 4
Download original image
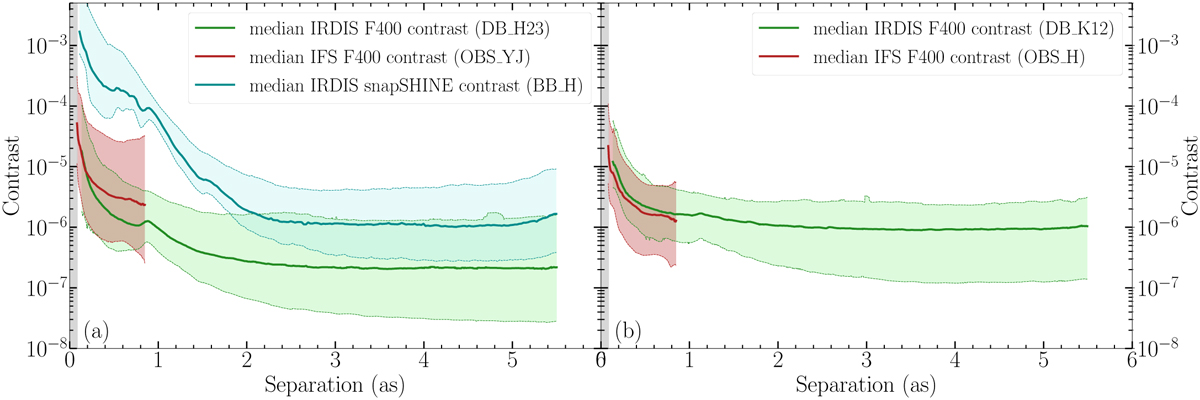
Contrast curves at 5σ obtained on the whole survey for both instruments, IRDIS in green and IFS in red. (a) IRDIFS setup. (b) IRDIFS-EXT setup. The contrast curves of the snapSHINE survey are represented in blue. The grey overlaid rectangles at small angular separations show the average inner working angle of the coronagraphic masks.
Current usage metrics show cumulative count of Article Views (full-text article views including HTML views, PDF and ePub downloads, according to the available data) and Abstracts Views on Vision4Press platform.
Data correspond to usage on the plateform after 2015. The current usage metrics is available 48-96 hours after online publication and is updated daily on week days.
Initial download of the metrics may take a while.