Fig. 1
Download original image
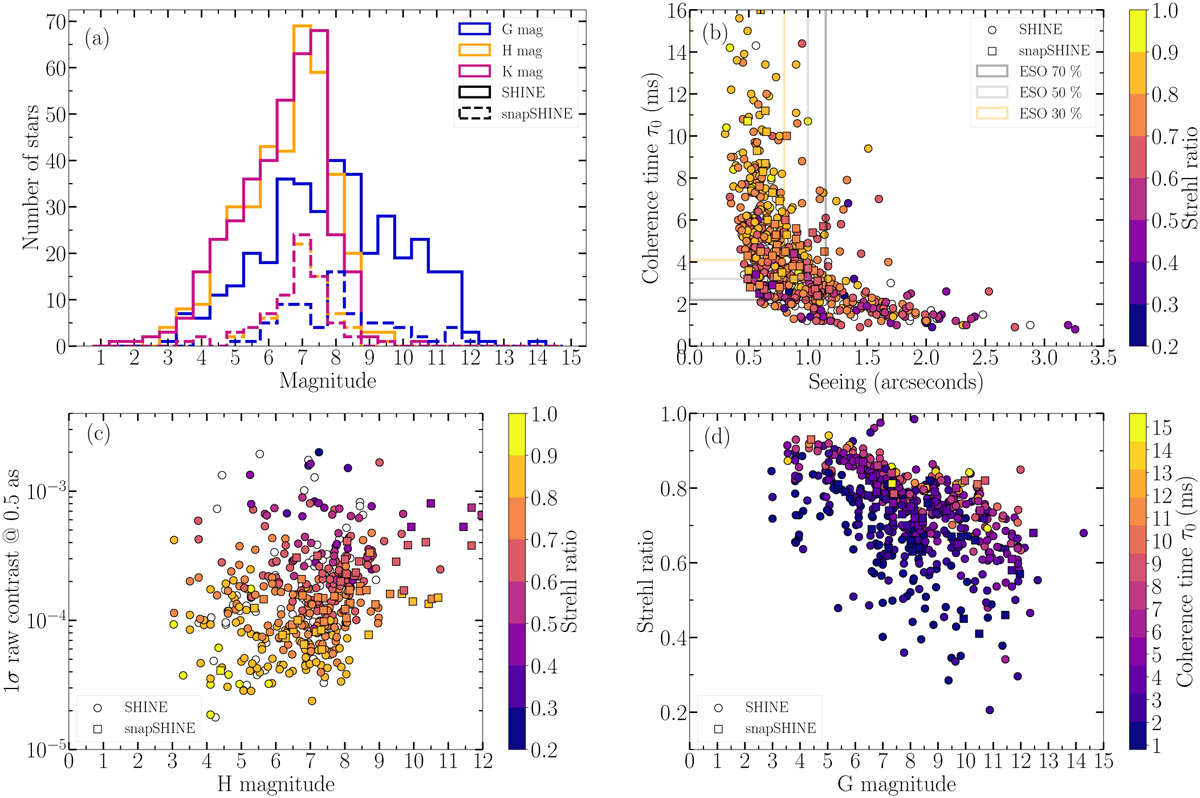
Overall data quality for SHINE and snapSHINE. (a) Histogram of the star magnitudes (G, H, K) for the sample considered in this study. (b) Scatter plot showing the coherence time (τ0) against the seeing with the Strehl ratio color-coded. Data points without SPARTA Strehl information are colored in white. The grey box delimits the ESO 50% best observing conditions (seeing <1 as and τ0 > 3.2 ms) whereas the yellow box delimits the 30% best (seeing <0.8 as and τ0 > 4.2 ms). (c) Scatter plot showing the 1σ raw contrast at 0.5 arcsec (directly measured on the coronagraphic frame, before post-processing) with respect to the H-band (main IRDIS band used in SHINE) star apparent magnitude. The best contrast performances are achieved for the brightest stars with a high Strehl ratio. (d) Scatter plot displaying the Strehl ratio as a function of the star’s apparent magnitude in the G band (AO spectral channel). As expected, the performances of the AO system deteriorate for fainter stars.
Current usage metrics show cumulative count of Article Views (full-text article views including HTML views, PDF and ePub downloads, according to the available data) and Abstracts Views on Vision4Press platform.
Data correspond to usage on the plateform after 2015. The current usage metrics is available 48-96 hours after online publication and is updated daily on week days.
Initial download of the metrics may take a while.