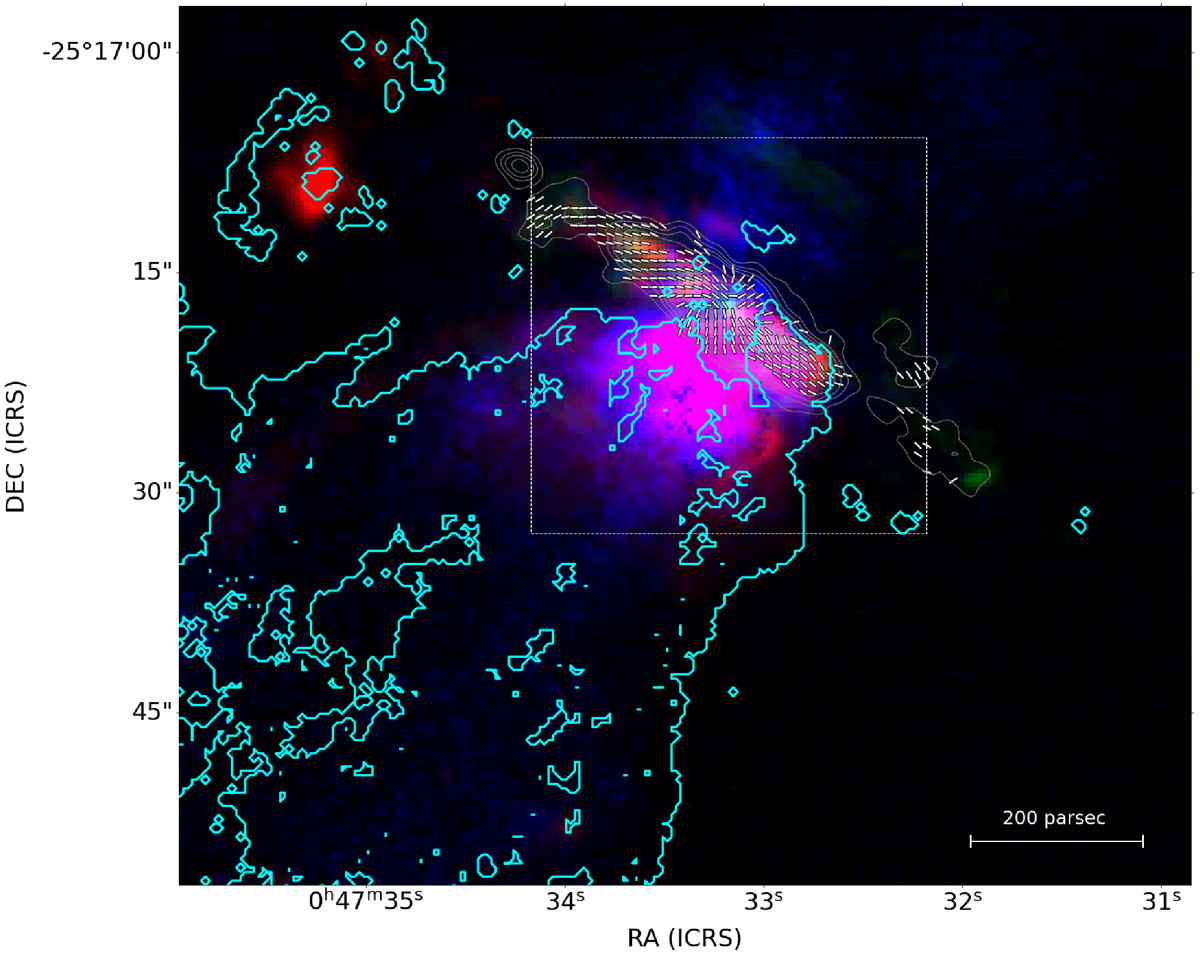
Fig. 8.
Download original image
Three-colour composite, multi-wavelength view of the central region in NGC253. Blue, red, and green show the X-ray emission from Lopez et al. (2023), optical [NII] data from Cronin et al. in prep., and CO(3-2) emission from Leroy et al. (2018), respectively. The B field lines and the emission of Stokes I flux of our ALMA Band 4 data are also shown as white vectors and yellow contours, respectively. The vectors are displayed every two pixels and only where PI/σPI > 3. The grey contours correspond to [5, 7, 10, 30, 100]×σI. The white rectangle marks the region shown on the upper panel of Fig. 9.
Current usage metrics show cumulative count of Article Views (full-text article views including HTML views, PDF and ePub downloads, according to the available data) and Abstracts Views on Vision4Press platform.
Data correspond to usage on the plateform after 2015. The current usage metrics is available 48-96 hours after online publication and is updated daily on week days.
Initial download of the metrics may take a while.