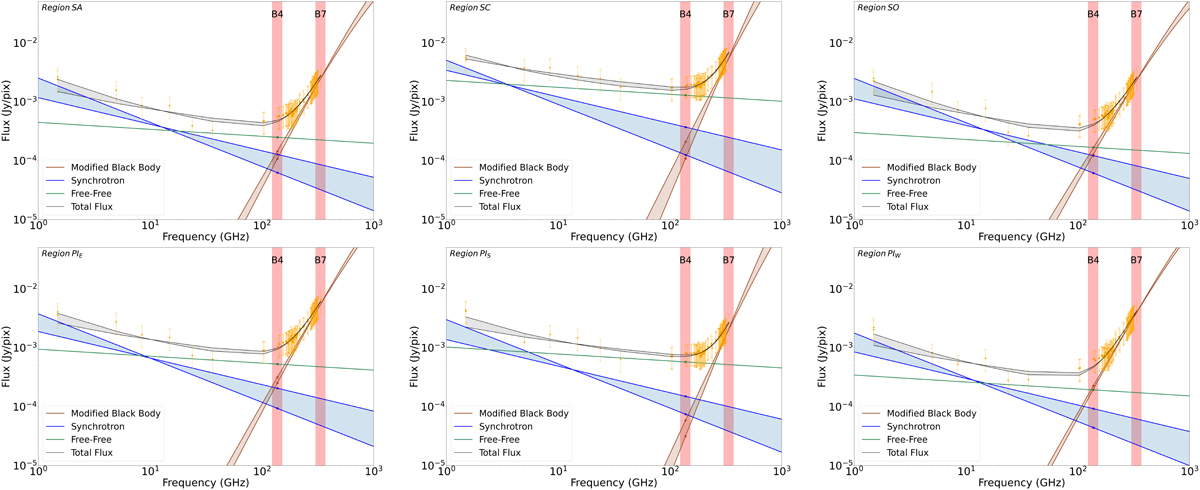
Fig. 6.
Download original image
SED-fitting analysis. The panels show the SED decomposition for the different regions (indicated in the top-left corner) discussed in Sect. 4. The observed measurements, shown by orange points with their uncertainties (±3σ) have been modelled using DustemWrap. The three fitted components: dust (in orange), synchrotron (in blue), and free-free (in green) are shown with shaded area indicating their range, assuming two different spectral index values.
Current usage metrics show cumulative count of Article Views (full-text article views including HTML views, PDF and ePub downloads, according to the available data) and Abstracts Views on Vision4Press platform.
Data correspond to usage on the plateform after 2015. The current usage metrics is available 48-96 hours after online publication and is updated daily on week days.
Initial download of the metrics may take a while.